OPEN-SOURCE SCRIPT
Kay_BBands
All right people... !!
Here is one more crazy stupid experiment by me while boosing. I call it..... Well Bollinger Bands for now..
If you like it and find it useful, give me suggestions, we can name it.
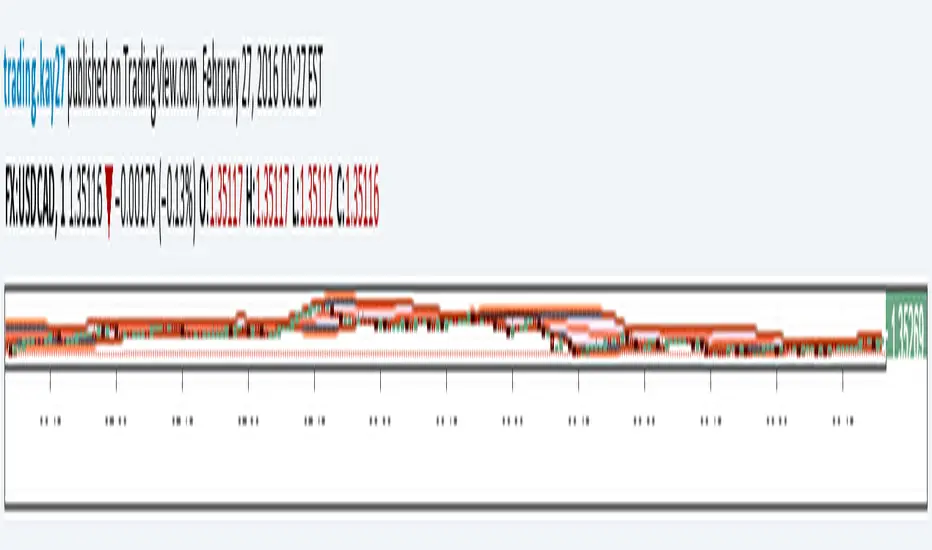
Its was just an idea of removing unnecessary opposite bands (noise i say) and it turned out to be useful to me.
After finishing, I saw good locations of support and resistance levels building.
Just connect the flat lines it create.
See if that interests you...!! Please leave comments below even if you are not in mood.
Thanks..
Here is one more crazy stupid experiment by me while boosing. I call it..... Well Bollinger Bands for now..
If you like it and find it useful, give me suggestions, we can name it.
Its was just an idea of removing unnecessary opposite bands (noise i say) and it turned out to be useful to me.
After finishing, I saw good locations of support and resistance levels building.
Just connect the flat lines it create.
See if that interests you...!! Please leave comments below even if you are not in mood.
Thanks..
Skrip open-source
Dengan semangat TradingView yang sesungguhnya, pembuat skrip ini telah menjadikannya sebagai sumber terbuka, sehingga para trader dapat meninjau dan memverifikasi fungsinya. Salut untuk penulisnya! Meskipun Anda dapat menggunakannya secara gratis, perlu diingat bahwa penerbitan ulang kode ini tunduk pada Tata Tertib kami.
Pernyataan Penyangkalan
Informasi dan publikasi ini tidak dimaksudkan, dan bukan merupakan, saran atau rekomendasi keuangan, investasi, trading, atau jenis lainnya yang diberikan atau didukung oleh TradingView. Baca selengkapnya di Ketentuan Penggunaan.