OPEN-SOURCE SCRIPT
M2 Money Shift for Bitcoin [SAKANE]

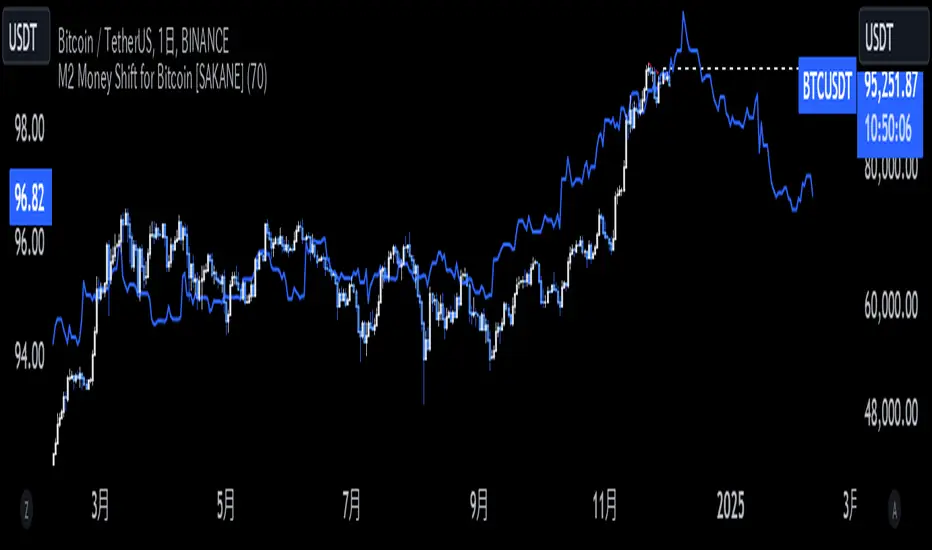
M2 Money Shift for Bitcoin was developed to visualize the impact of M2 Money, a macroeconomic indicator, on the Bitcoin market and to support trade analysis.
Bitcoin price fluctuations have a certain correlation with cycles in M2 money supply.In particular, it has been noted that changes in M2 supply can affect the bitcoin price 70 days in advance.Very high correlations have been observed in recent years in particular, making it useful as a supplemental analytical tool for trading.
Support for M2 data from multiple countries
M2 supply data from the U.S., Europe, China, Japan, the U.K., Canada, Australia, and India are integrated and all are displayed in U.S. dollar equivalents.
Slide function
Using the "Slide Days Forward" setting, M2 data can be slid up to 500 days, allowing for flexible analysis that takes into account the time difference from the bitcoin price.
Plotting Total Liquidity
Plot total liquidity (in trillions of dollars) by summing the M2 supply of multiple countries.
How to use
After applying the indicator to the chart, activate the M2 data for the required country from the settings screen. 2.
2. adjust "Slide Days Forward" to analyze the relationship between changes in M2 supply and bitcoin price
3. refer to the Gross Liquidity plot to build a trading strategy that takes into account macroeconomic influences.
Notes.
This indicator is an auxiliary tool for trade analysis and does not guarantee future price trends.
The relationship between M2 supply and bitcoin price depends on many factors and should be used in conjunction with other analysis methods.
Skrip open-source
Dengan semangat TradingView yang sesungguhnya, pembuat skrip ini telah menjadikannya sebagai sumber terbuka, sehingga para trader dapat meninjau dan memverifikasi fungsinya. Salut untuk penulisnya! Meskipun Anda dapat menggunakannya secara gratis, perlu diingat bahwa penerbitan ulang kode ini tunduk pada Tata Tertib kami.
Pernyataan Penyangkalan
Informasi dan publikasi ini tidak dimaksudkan, dan bukan merupakan, saran atau rekomendasi keuangan, investasi, trading, atau jenis lainnya yang diberikan atau didukung oleh TradingView. Baca selengkapnya di Ketentuan Penggunaan.