OPEN-SOURCE SCRIPT
The Commitment of Traders (COT) Index
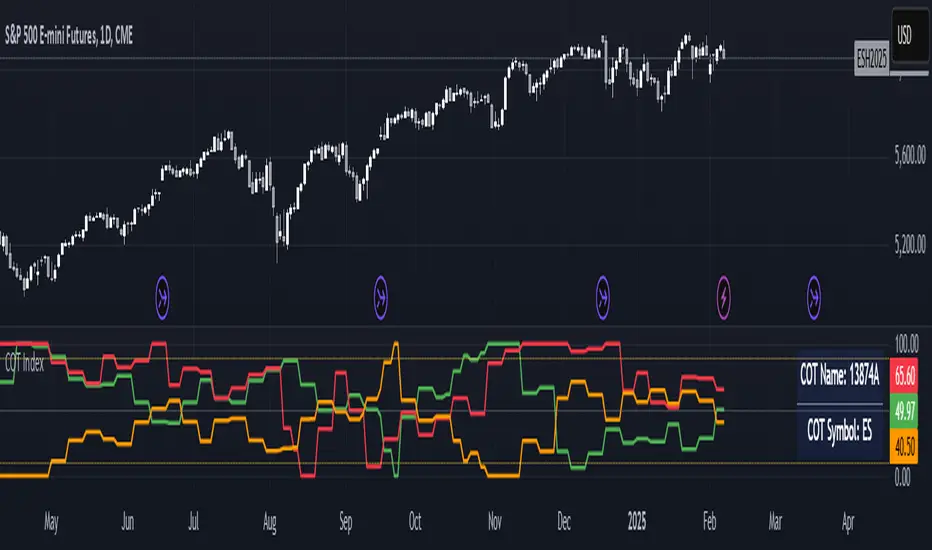
The COT Index indicator is used to measure the positioning of different market participants (Large Traders, Small Traders, and Commercial Hedgers) relative to their historical positioning over a specified lookback period. It helps traders identify extreme positioning, which can signal potential reversals or trend continuations.
Key Features of the Indicator:
COT Data Retrieval
The script pulls COT report data from the TradingView COT Library TradingView/LibraryCOT/3).
It retrieves long and short positions for three key groups:
Large Traders (Non-commercial positions) – Speculators such as hedge funds.
Small Traders (Non-reportable positions) – Small retail traders.
Commercial Hedgers (Commercial positions) – Institutions that hedge real-world positions.
Threshold Zones for Extreme Positioning:
Upper Zone Threshold (Default: 90%)
Signals potential overbought conditions (excessive buying).
Lower Zone Threshold (Default: 10%)
Signals potential oversold conditions (excessive selling).
The indicator plots these zones using horizontal lines.
The COT Index should be used in conjunction with technical analysis (support/resistance, trends, etc.). A high COT Index does not mean the market will reverse immediately—it’s an indication of extreme sentiment.
Note:
If the script does not recognize or can't find the ticker currently viewed in the COT report, the COT indicator will default to U.S. Dollar.
Skrip open-source
Dengan semangat TradingView yang sesungguhnya, pembuat skrip ini telah menjadikannya sebagai sumber terbuka, sehingga para trader dapat meninjau dan memverifikasi fungsinya. Salut untuk penulisnya! Meskipun Anda dapat menggunakannya secara gratis, perlu diingat bahwa penerbitan ulang kode ini tunduk pada Tata Tertib kami.
Pernyataan Penyangkalan
Informasi dan publikasi ini tidak dimaksudkan, dan bukan merupakan, saran atau rekomendasi keuangan, investasi, trading, atau jenis lainnya yang diberikan atau didukung oleh TradingView. Baca selengkapnya di Ketentuan Penggunaan.