OPEN-SOURCE SCRIPT
Diupdate Smarter MACD
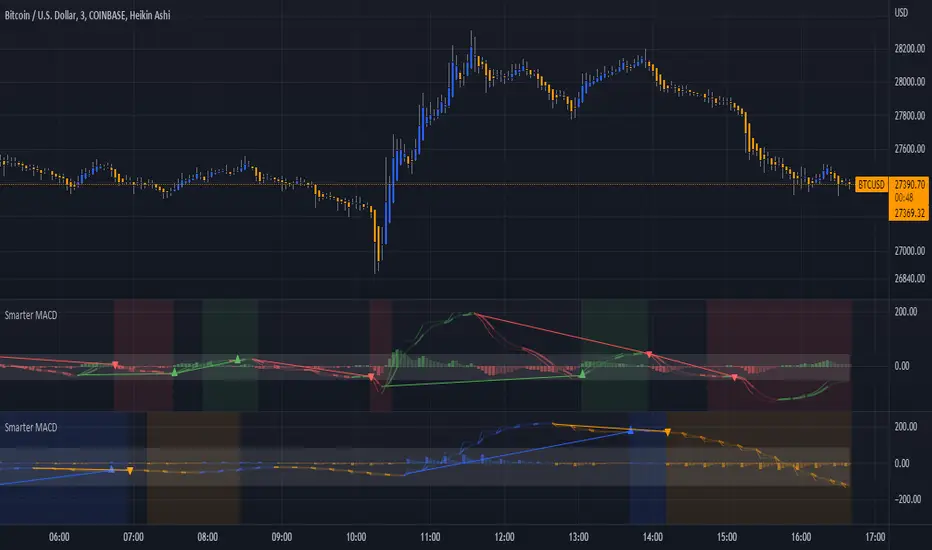
A classic MACD with average peak and dip lines. The lighter green and red horizontal lines are the average peak and dip of the entire span, respectively. The second, bolder of the two lines are the averages of the peaks and dips above and below the overall peak and dip averages. The filled in color is to help visualize these averages and possible trade setups. Rework of the MACD + Averages script.
Catatan Rilis
Clarified momentum divergence signalsCatatan Rilis
Clarified momentum divergence markersCatatan Rilis
Added background coloring to better visualize clear bullish or bearish momentumCatatan Rilis
Added background coloring to better visualize clear bullish or bearish momentum, credits, updated indicator preview, and discord link.Don't forget to join the Discord group: discord.gg/fsbbhDZ3
Catatan Rilis
Added ATF (Adjustable Time Frame) for detecting confluence with higher timeframes, as well as color controls to differentiate between the two timeframes. By adding two to a chart, you can merge them to create overlaps by clicking on the ellipses on the indicator (...), clicking "Move To", and clicking the "Existing Pane Above" or "Existing Pane Below" options.Skrip open-source
Dengan semangat TradingView yang sesungguhnya, pembuat skrip ini telah menjadikannya sebagai sumber terbuka, sehingga para trader dapat meninjau dan memverifikasi fungsinya. Salut untuk penulisnya! Meskipun Anda dapat menggunakannya secara gratis, perlu diingat bahwa penerbitan ulang kode ini tunduk pada Tata Tertib kami.
Pernyataan Penyangkalan
Informasi dan publikasi ini tidak dimaksudkan, dan bukan merupakan, saran atau rekomendasi keuangan, investasi, trading, atau jenis lainnya yang diberikan atau didukung oleh TradingView. Baca selengkapnya di Ketentuan Penggunaan.
Skrip open-source
Dengan semangat TradingView yang sesungguhnya, pembuat skrip ini telah menjadikannya sebagai sumber terbuka, sehingga para trader dapat meninjau dan memverifikasi fungsinya. Salut untuk penulisnya! Meskipun Anda dapat menggunakannya secara gratis, perlu diingat bahwa penerbitan ulang kode ini tunduk pada Tata Tertib kami.
Pernyataan Penyangkalan
Informasi dan publikasi ini tidak dimaksudkan, dan bukan merupakan, saran atau rekomendasi keuangan, investasi, trading, atau jenis lainnya yang diberikan atau didukung oleh TradingView. Baca selengkapnya di Ketentuan Penggunaan.