OPEN-SOURCE SCRIPT
Diupdate wick CE; plot candle wick and tail midpoint lines
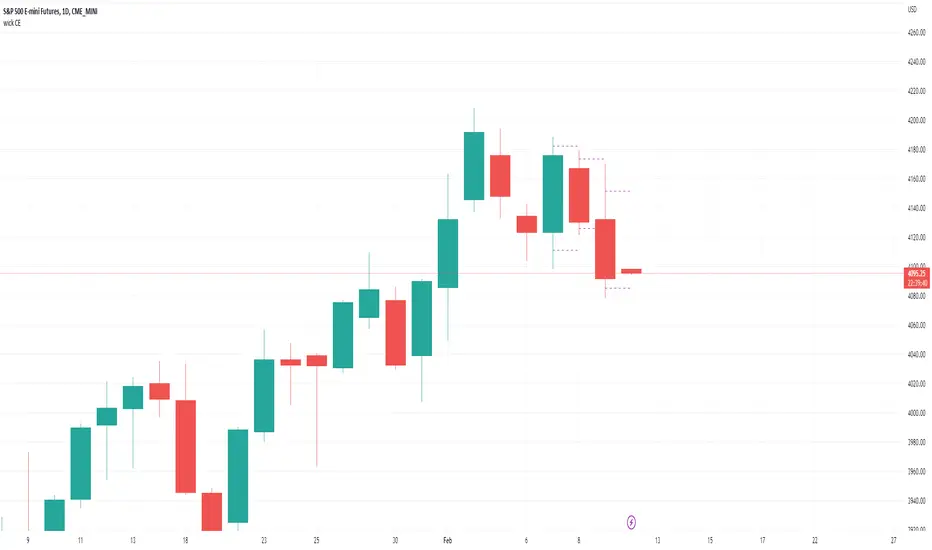
-Simple little tool to plot the wick CE: an ICT concept, consequent encroachment i.e. the midpoint line of a wick or tail; it being a potentially sensitive level (depending on context).
-Wrote this to save me time drawing out fib retracement to locate the precise level of the wick CE. Example usage: show indicator, add horizontal ray over favored wick CE level, hide indicator.
~choose how many consecutive bars back to plot wick CE lines.
~choose how many bars forward to extend the wick CE lines.
Catatan Rilis
-increased max_bars_back and max_lines_count to allow for much larger lookbackCatatan Rilis
-added option to show candle body midlines too ('MT' = mean threshold)Catatan Rilis
-added optional retracement levels (75% and 25% of high-low range); default is off.-added minimum wick size input (based on multiples of chart symbols mintick value) to filter out small wicks; (default = 1; i.e. will only filter out wick CEs where the wick is tiny or non-existent).
-added option to show chart symbol's mintick value in top right corner of chart (default off).
Catatan Rilis
-change show current bar to default trueCatatan Rilis
Updated to include higher timeframe wick CE & tail CE overlayed on lower timeframe chart.Choose between realtime display and previous completed HTF display (default).
Image shows 15min chart with Daily wick CE and tail CE levels displayed.
Catatan Rilis
corrections on screenshot above:*previous trading day
*wick/tail CE levels of previous trading day
Choose from a range of higher timeframe inputs
Skrip open-source
Dengan semangat TradingView yang sesungguhnya, pembuat skrip ini telah menjadikannya sebagai sumber terbuka, sehingga para trader dapat meninjau dan memverifikasi fungsinya. Salut untuk penulisnya! Meskipun Anda dapat menggunakannya secara gratis, perlu diingat bahwa penerbitan ulang kode ini tunduk pada Tata Tertib kami.
You can buy me a coffee here...
PayPal.Me/twingall
BTC: 3JrhUwNRnKyqhaa1n1AXKeAubNeEFoch6S
ETH erc20: 0x4b0400B1c18503529ab69611e82a934DDe4Ab038
ETH bep20: 0x1F0f03F184079bb1085F8C9dF3a8191C9f5869B3
PayPal.Me/twingall
BTC: 3JrhUwNRnKyqhaa1n1AXKeAubNeEFoch6S
ETH erc20: 0x4b0400B1c18503529ab69611e82a934DDe4Ab038
ETH bep20: 0x1F0f03F184079bb1085F8C9dF3a8191C9f5869B3
Pernyataan Penyangkalan
Informasi dan publikasi ini tidak dimaksudkan, dan bukan merupakan, saran atau rekomendasi keuangan, investasi, trading, atau jenis lainnya yang diberikan atau didukung oleh TradingView. Baca selengkapnya di Ketentuan Penggunaan.