The Multi Touch Confluence Indicator Subplot
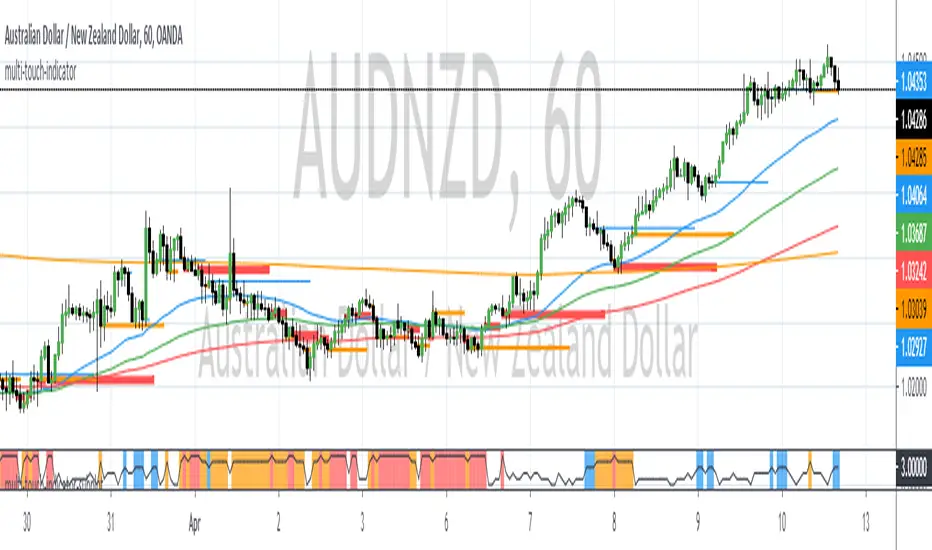
The confluence zone is specified as a point difference.
When confluence is found, the indicator will paint vertical lines of different color and width.
- Blue Zones indicate a confluence of 3 EMAs across all time frames
- Orange Zones indicate a confluence of 4 EMAs across all time frames
- Red Zones indicate a confluence of 5 or more EMAs across all time frames.
The maximum number of time frames being used is 6.
The maximum number of EMAs per time frame is 4.
When confluence occurs it usually indicates a precursor of price expansion. This indicator can be used to determine when momentum is about to come back into the market.
Skrip hanya-undangan
Hanya pengguna yang disetujui oleh penulis yang dapat mengakses skrip ini. Anda perlu meminta dan mendapatkan izin untuk menggunakannya. Izin ini biasanya diberikan setelah pembayaran. Untuk detail selengkapnya, ikuti petunjuk penulis di bawah ini atau hubungi LiquidityTracker secara langsung.
TradingView TIDAK menyarankan untuk membayar atau menggunakan skrip kecuali Anda sepenuhnya mempercayai pembuatnya dan memahami cara kerjanya. Anda juga dapat menemukan alternatif yang gratis dan sumber terbuka di skrip komunitas kami.
Instruksi penulis
Pernyataan Penyangkalan
Skrip hanya-undangan
Hanya pengguna yang disetujui oleh penulis yang dapat mengakses skrip ini. Anda perlu meminta dan mendapatkan izin untuk menggunakannya. Izin ini biasanya diberikan setelah pembayaran. Untuk detail selengkapnya, ikuti petunjuk penulis di bawah ini atau hubungi LiquidityTracker secara langsung.
TradingView TIDAK menyarankan untuk membayar atau menggunakan skrip kecuali Anda sepenuhnya mempercayai pembuatnya dan memahami cara kerjanya. Anda juga dapat menemukan alternatif yang gratis dan sumber terbuka di skrip komunitas kami.