Pivot Points ++
This is a Leading Indicator which computes a series of key levels that might act as Support and Resistance over the selected time frame period.
This version of the Pivot Points delivers a convenient way to visualize its information. It’s been designed for it to be useful to a variety of trading styles: from the ones that use it to detect reversal points, to the ones that gauge the market at a single glance.
HOW TO READ THE PIVOT POINTS
Pivot Points set a series of price levels which remain constant through the time period (which could be: daily, weekly, monthly, yearly or multi-yearly).
At the beginning of a new time period, it calculates the main Pivot Point Level (PP), and depending on the type, it can compute up to 5 Support Levels (S1 to S5) and 5 Resistance Levels (R1 to R5).
Being such a universal indicator, there exist many ways of reading the Pivot Levels. Now, let’s see some common uses of the indicator.
Warning: Please don’t rely on a single indicator to make your trading decisions, but rather integrate it into a coherent system combining it with complementary signals.
- Support and Resistance: This is a straightforward approach. Each Pivot Level may act as Support or Resistance. For instance the level S1 initially behaves as Support. As price gets closer, one may observe that the level is being respected and price bounces around the level. Or in case it would get broken, then it would automatically shift its role into a Resistance Level.
- Mood Gauge: One can quickly gauge the mood of the market by seeing where price stands in relation to the Main Pivot Point Level (PP). Above the Pivot point is generally interpreted as bullish, whilst standing below implies a bearish tone.
- Stop Loss and Profit Levels: When entering on a trade, one can use the Pivot Levels to set the Stop Loss behind it, or set the Take Profit in an area surrounding it.
- Agreement with Fibonacci Retracements or Expansions: One can combine the power of these 2 leading indicators in search for Agreement areas where to find both a significant Pivot Level and a Relevant Fibonacci Level.
- Volume or Volatility Squeezes: Some traders focus on the Pivot Levels in combination with Volume or Volatility readings, in order to anticipate turning points or continuation legs.
WHY WOULD YOU BE INTERESTED IN THIS INDICATOR?
Pivot Points ++ has been designed to address the needs of dedicated traders. Let’s review its main features.
Display up to 9 sets of Pivot Points simultaneously
- Long term view: As an analyst and as a trader, being able to display many sets of Pivot Points simultaneously is of great advantage when assessing long term views on the market.
- Pivot Levels clearly Identified: Each set of Pivot Points get clearly identified with a prefaced letter indicating its time frame, i.e. Yearly Pivot Point appears as YPP and Monthly Pivot Resistance 1 appears as MR1.
- Minimalistic coloring: The Main Pivot Levels are highlighted in color to stand out, yet the intention of the indicator is to be as minimalistic and keep the chart as clean as possible.
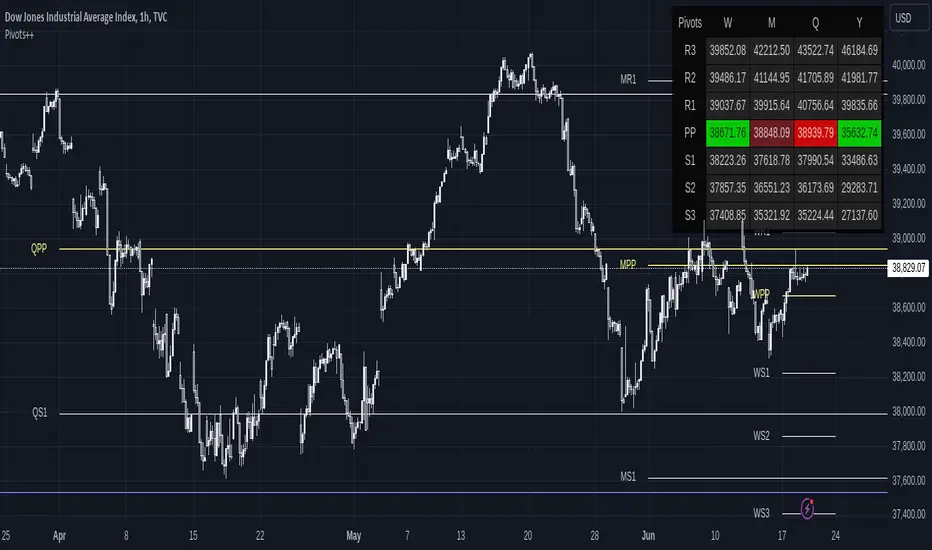
Display Pivots as a Panel
- Panel View: Display the Pivot Points’ information in the way that better suits your charting style. In addition to displaying the lines over the price chart, the indicator allows displaying the data on a Panel. The Panel view can be used together with the Line view, or it can be used in isolation.
- Fully customizable: Its location, size and its design parameters can be customized through the Settings tab.
- Common sense formatting: It displays a column for each of the selected time frames, and a row for each of the selected Pivot Levels. When a Pivot Level displays in colors, it means that price is currently trading above (green) or below (red) that level. Moreover, when the current price is trading just near the Pivot Level, the color shifts to Dark Red when it’s acting as a Resistance, and Dark Green when it acts as Support.
Keep your Chart Clean!
Disciplined traders keep their charts clean. One needs proper focus to trade in the zone.
Please check how the chart on the left looks compared to the one on the right. Both display exactly the same Pivot Points.
The chart on the left contributes to a more minimalistic display of information, as for when a trader wishes to quickly check where the price is trading in relation to the Pivot Points. Moreover, the chart on the right has the advantage to display clearly the Reversals and Price Reactions in relation to the Pivot Points. The decision is yours.
Show only Pivots Relevant to the Current Time Frame
The sets of Pivot Points belonging to time frames Below or Near the current Time Frame get hidden to prevent overcrowding the chart with lines. Nevertheless, this feature can be disabled through the Settings tab.
These are the preset Time Frames:
- Intraday/Scalping: Those operating on time frames below 1H will be able to see the whole range of Pivot Levels.
- 1H: Traders operating on 1-Hour Charts display Pivots from Weekly and above. Daily Pivot Points get hidden.
- 4H: On 4-Hour Charts, Monthly Pivots and above get displayed. Weekly Pivot Points get hidden.
- D: On Daily Charts, Quarterly Pivots and above get displayed. Monthly Pivot Points get hidden.
- W: On Weekly Charts, Yearly Pivots and above get displayed. Quarterly Pivot Points get hidden.
- M: On Monthly Charts, Tri-Yearly Pivots and above get displayed. Yearly and Bi-Yearly Pivot Points get hidden.
- 3M and 12M: Above Monthly Charts, only Decennial Pivots get displayed. All the rest get hidden.
Good Looking right off the box
- It looks good: The indicator will look just fine on most of the charts. It displays well on dark themed charts and on light themed charts. No need to mess up with the coloring of the indicator for it to display properly.
- Fully customizable: Nevertheless, you can easily override the defaults and customize the Colors and Line Styles for each Pivot Level.
Displays True on Heikin Ashi Charts
That’s good news for scalpers, because Pivot Points get computed correctly even when being displayed over Heiken Ashi charts.
SETTINGS
Now let’s dive into the settings of this indicator.
Display: It allows to enable/disable the display of the following:
- Lines and Panel: Switch on/off the general view of the Lines over the chart or the Panel.
- Pivot, R1 to R5, S1 to S5: Select which Pivot Levels will be displayed.
- Labels and Price: It applies only to Lines. Allows to select which information to display near the Pivot Level, and whether to place it right or left of the line.
- Auto Hide Pivots from Near Time Frames: By default it hides the sets of Pivot Points from time frames near the current one. Disabling this one allows to display all the Pivot Points from higher time frames, regardless whether they are near.
- Move Pivots to the Right: This selection moves all the current Pivot Points to the Right Hand Side of the Chart, in order to keep the main area of the chart clean of lines. This setting allows customizing the how far to the right from the last candle (Offset) and how wide to draw the levels (Width).
Pivots: It sets up the conditions for each of the 9 sets of Pivot Levels. It includes the following:
- General checkmark: Allows displaying or hiding that set of Pivots.
- Time Frame: Select the time frame for which the Pivot Point will be computed.
- Type: Select the type of Pivot Point: Traditional, Fibonacci, Woodie, Classic, DM or Camarilla.
- Lines: Enable/Disable the display of this Pivot as Lines over the chart.
- Panel: Enable/Disable the display of this Pivot in the Panel.
Panel Display: It allows customizing the position of the Panel. It includes the following:
- Vertical Position: Top, Middle or Bottom of the chart.
- Horizontal Position: Left, Center or Right of the chart.
- Size of the Panel: Auto, Huge, Large, Normal, Small or Tiny.
Parameters: It applies only to the Line View. It includes the following:
- Pivots Back: By default the indicator only shows the current Pivot Levels, but it can display up to 10 past instances of each pivot.
- Support and Resistance Price Reference: It allows to specify which price should it take into account to define a Pivot Level acting as Support or Resistance.
- Support and Resistance % Area: It defines the size of the zone around each Pivot Level in which it acts as Support or Resistance.
Theming Panel: It applies only to the Panel View. It allows customizing every color used in the Panel.
Theming Pivot #1 to #9: It applies only to the Line View. It includes the following:
- Thickness: Customize the line thickness for all the lines within that set of Pivot Points.
- Style: Customize the line style for all the lines within that set of Pivot Points. It can be drawn as a Solid, Dotted or Dashed line.
- Colors: Customize the color for each Pivot Level.
Skrip hanya-undangan
Hanya pengguna yang disetujui oleh penulis yang dapat mengakses skrip ini. Anda perlu meminta dan mendapatkan izin untuk menggunakannya. Izin ini biasanya diberikan setelah pembayaran. Untuk detail selengkapnya, ikuti petunjuk penulis di bawah ini atau hubungi gliderfund secara langsung.
TradingView TIDAK menyarankan untuk membayar atau menggunakan skrip kecuali Anda sepenuhnya mempercayai pembuatnya dan memahami cara kerjanya. Anda juga dapat menemukan alternatif yang gratis dan sumber terbuka di skrip komunitas kami.
Instruksi penulis
Pernyataan Penyangkalan
Skrip hanya-undangan
Hanya pengguna yang disetujui oleh penulis yang dapat mengakses skrip ini. Anda perlu meminta dan mendapatkan izin untuk menggunakannya. Izin ini biasanya diberikan setelah pembayaran. Untuk detail selengkapnya, ikuti petunjuk penulis di bawah ini atau hubungi gliderfund secara langsung.
TradingView TIDAK menyarankan untuk membayar atau menggunakan skrip kecuali Anda sepenuhnya mempercayai pembuatnya dan memahami cara kerjanya. Anda juga dapat menemukan alternatif yang gratis dan sumber terbuka di skrip komunitas kami.