OPEN-SOURCE SCRIPT
Diupdate Stochastic Trend mtf
Definition
The Stochastic RSI indicator (Stoch RSI) is actually an indicator of an indicator. It is used in technical analysis to provide a stochastic calculation to the RSI indicator. This means it's an RSI measure relative to its own high/low range over a user-defined time period. Stochastic RSI is an oscillator that calculates a value between 0 and 1 and then plots it as a line. This indicator is primarily used to identify overbought and oversold conditions.
It is important to remember that the Stoch RSI is an indicator of an indicator that is two steps away from the price. The RSI is one step away from the price and therefore a stochastic calculation of the RSI is two steps away. This is important because as with any indicator that is more than one step away from price, the Stoch RSI can be short-term disconnected from actual price action. However, as a range-bound indicator, the Stoch RSI's primary function is to identify cross-bought, overbought and oversold conditions.
Use
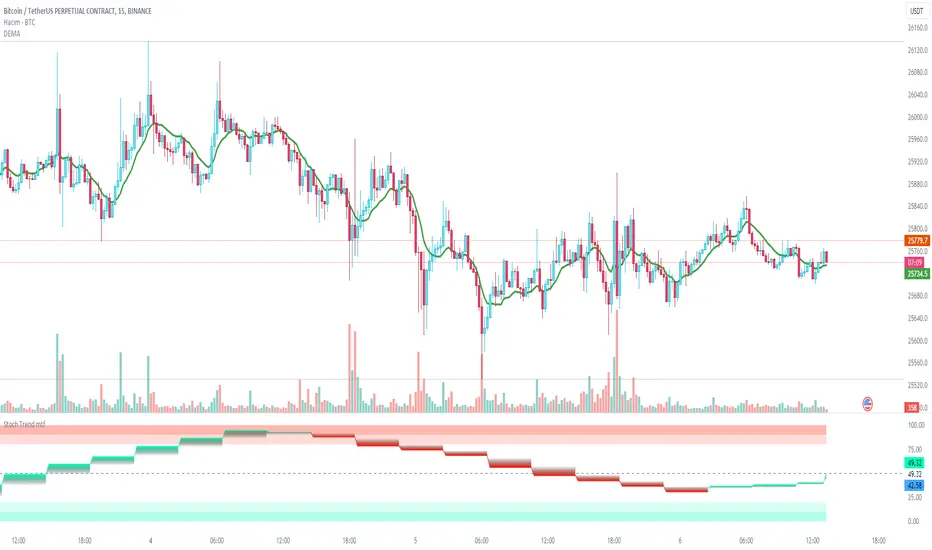
When we integrate it into our chart in the upper time frame, it both gives the direction of the trend more healthy and is more efficient in terms of noise reduction in terms of leaving the overbought-sold zones. Unlike the classic stochastic, I set the "d" value to 8. Even though the trend returns are a little late, we see healthier data on our graph. Trend changes in overbought zones are getting stronger. Coloring red indicates that the trend is selling, while painting green indicates that the trend is buying. I hope you find it useful, if you have any questions or suggestions, please feel free to ask.
Good luck...
It is not investment advice.
The Stochastic RSI indicator (Stoch RSI) is actually an indicator of an indicator. It is used in technical analysis to provide a stochastic calculation to the RSI indicator. This means it's an RSI measure relative to its own high/low range over a user-defined time period. Stochastic RSI is an oscillator that calculates a value between 0 and 1 and then plots it as a line. This indicator is primarily used to identify overbought and oversold conditions.
It is important to remember that the Stoch RSI is an indicator of an indicator that is two steps away from the price. The RSI is one step away from the price and therefore a stochastic calculation of the RSI is two steps away. This is important because as with any indicator that is more than one step away from price, the Stoch RSI can be short-term disconnected from actual price action. However, as a range-bound indicator, the Stoch RSI's primary function is to identify cross-bought, overbought and oversold conditions.
Use
When we integrate it into our chart in the upper time frame, it both gives the direction of the trend more healthy and is more efficient in terms of noise reduction in terms of leaving the overbought-sold zones. Unlike the classic stochastic, I set the "d" value to 8. Even though the trend returns are a little late, we see healthier data on our graph. Trend changes in overbought zones are getting stronger. Coloring red indicates that the trend is selling, while painting green indicates that the trend is buying. I hope you find it useful, if you have any questions or suggestions, please feel free to ask.
Good luck...
It is not investment advice.
Catatan Rilis
DefinitionThe Stochastic RSI indicator (Stoch RSI) is actually an indicator of an indicator. It is used in technical analysis to provide a stochastic calculation to the RSI indicator. This means it's an RSI measure relative to its own high/low range over a user-defined time period. Stochastic RSI is an oscillator that calculates a value between 0 and 1 and then plots it as a line. This indicator is primarily used to identify overbought and oversold conditions.
It is important to remember that the Stoch RSI is an indicator of an indicator that is two steps away from the price. The RSI is one step away from the price and therefore a stochastic calculation of the RSI is two steps away. This is important because as with any indicator that is more than one step away from price, the Stoch RSI can be short-term disconnected from actual price action. However, as a range-bound indicator, the Stoch RSI's primary function is to identify cross-bought, overbought and oversold conditions.
Use
When we integrate it into our chart in the upper time frame, it both gives the direction of the trend more healthy and is more efficient in terms of noise reduction in terms of leaving the overbought-sold zones. Unlike the classic stochastic, I set the "d" value to 8. Even though the trend returns are a little late, we see healthier data on our graph. Trend changes in overbought zones are getting stronger. Coloring red indicates that the trend is selling, while painting green indicates that the trend is buying. I hope you find it useful, if you have any questions or suggestions, please feel free to ask.
Good luck...
It is not investment advice.
Bar color feature added. 12/08/2024
Skrip open-source
Dengan semangat TradingView yang sesungguhnya, pembuat skrip ini telah menjadikannya sebagai sumber terbuka, sehingga para trader dapat meninjau dan memverifikasi fungsinya. Salut untuk penulisnya! Meskipun Anda dapat menggunakannya secara gratis, perlu diingat bahwa penerbitan ulang kode ini tunduk pada Tata Tertib kami.
Pernyataan Penyangkalan
Informasi dan publikasi ini tidak dimaksudkan, dan bukan merupakan, saran atau rekomendasi keuangan, investasi, trading, atau jenis lainnya yang diberikan atau didukung oleh TradingView. Baca selengkapnya di Ketentuan Penggunaan.