OPEN-SOURCE SCRIPT
EMA (20, 50, 100, 200) incl. TIMEFRAME!
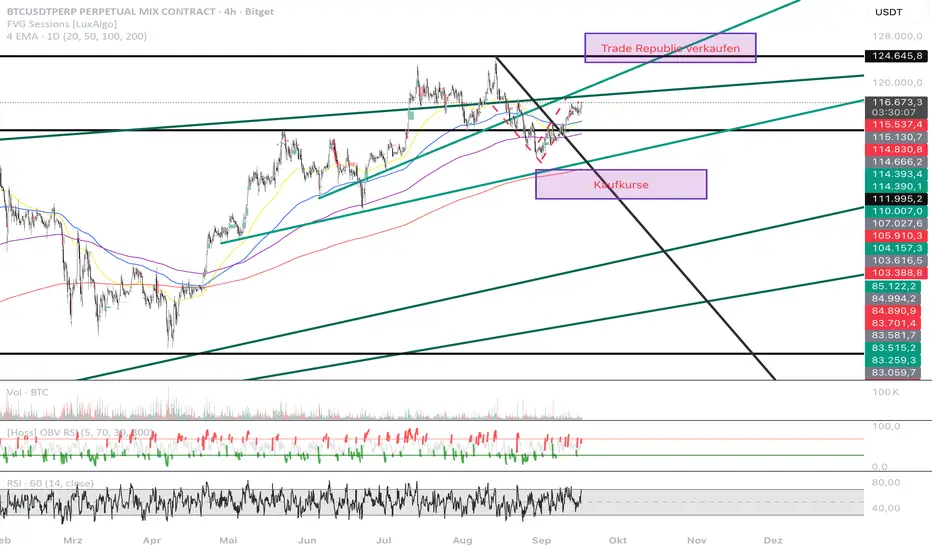
Multi-Timeframe EMA Indicator
Indicator designed for TradingView that plots up to four distinct Exponential Moving Average (EMA) lines on your chart. The script is highly flexible, allowing you to configure each EMA's length and color individually. Additionally, it features a crucial timeframe parameter, which enables you to apply the EMAs from a different, higher timeframe directly to your current chart.
Key Features:
Four Independent EMAs: The indicator calculates and displays four separate EMA lines simultaneously. The default lengths are set to the popular values of 20, 50, 100, and 200, which are commonly used for short-term, medium-term, and long-term trend analysis.
Customizable Length and Color: You have full control over each EMA. In the indicator's settings, you can easily change the length of each moving average to suit your trading strategy. You can also customize the color of each line, making it easy to distinguish them on the chart.
Multi-Timeframe Analysis (MTF): The most powerful feature is the timeframe parameter. By entering a different timeframe (e.g., "D" for daily, "W" for weekly, or "60" for hourly), the indicator will calculate the EMAs based on that specific timeframe's data, regardless of your chart's current resolution. This is invaluable for traders who want to see long-term trends on a short-term chart without having to switch timeframes.
Skrip open-source
Dengan semangat TradingView yang sesungguhnya, penulis skrip ini telah menjadikannya sumber terbuka, sehingga para trader dapat meninjau dan memverifikasi fungsinya. Hormat untuk penulisnya! Meskipun anda dapat menggunakannya secara gratis, ingatlah bahwa penerbitan ulang kode tersebut tunduk pada Tata Tertib kami.
Pernyataan Penyangkalan
Informasi dan publikasi tidak dimaksudkan untuk menjadi, dan bukan merupakan saran keuangan, investasi, perdagangan, atau rekomendasi lainnya yang diberikan atau didukung oleh TradingView. Baca selengkapnya di Persyaratan Penggunaan.