PROTECTED SOURCE SCRIPT
LiqD HeatMap [RubiXalgo]
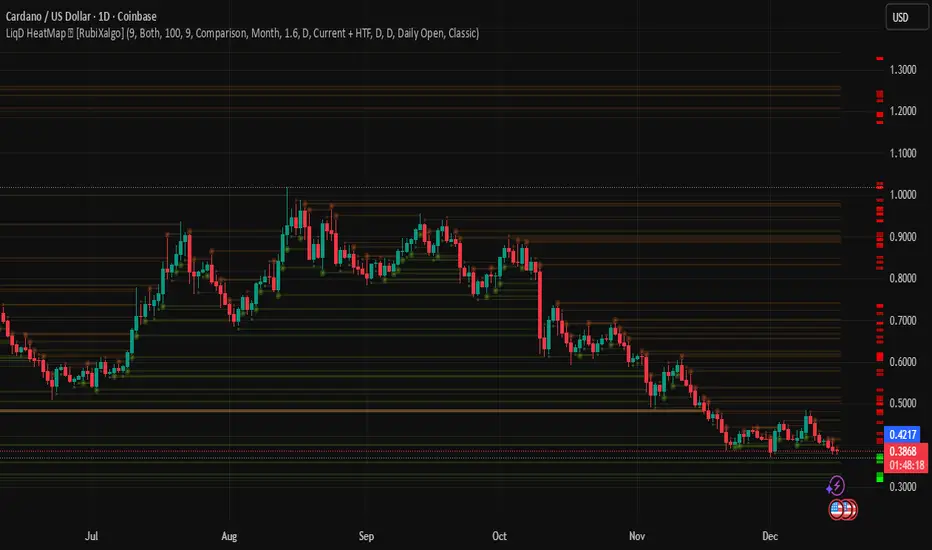
LiqD HeatMap 👑 [RubiXalgo] – Advanced Liquidation & Liquidity Visualizer
Discover potential liquidation zones with this powerful AI-enhanced heatmap indicator. It visualizes high-volume liquidity pools where price may attract or reverse, using dynamic bubbles, horizontal levels, and gradient colors for intuitive signals.
Key Features:
• Liquidation Heatmap Bubbles — Circles plotted above/below bars indicate potential long/short liquidation clusters. Larger/darker bubbles highlight stronger volume-based zones.
• Multi-Timeframe Liquidity Levels — Horizontal lines from 30min to Monthly timeframes (thicker/brighter for higher TFs) mark key support/resistance where liquidations often occur.
• Dynamic Color Gradients — Green/teal for bullish bias, red/purple for bearish, yellow/orange for max-volume hotspots. Adjustable intensity for clearer signals.
• Additional Tools:
- Customizable VWAP with ATR bands for directional bias.
- A.I. Volume Profit-Trend polyline predictions.
- Stochastic Money Flow & Bollinger Band Width percentages.
- Daily 0.618 Fibonacci Range Expansion projections.
• Filters & Customization — Market bias (Long/Short/Both), leverage scaling, dynamic lookback, and color themes (Classic or Crypto).
How to Trade with It:
Long Signals: Look for dark green bubbles below price or price bouncing/breaking thick green MTF levels → strong bullish liquidation potential.
Short Signals: Dark red bubbles above price or breakdowns of thick red levels → bearish liquidation zones.
Yellow/orange highlights max-volume areas often acting as magnets or reversal points.
Perfect for crypto, forex, or futures traders seeking volume-driven edge without clutter. 👑 Powered by RubiXalgo logic.
Skrip terproteksi
Skrip ini diterbitkan sebagai sumber tertutup. Namun, Anda dapat menggunakannya dengan bebas dan tanpa batasan apa pun – pelajari lebih lanjut di sini.
Pernyataan Penyangkalan
Informasi dan publikasi ini tidak dimaksudkan, dan bukan merupakan, saran atau rekomendasi keuangan, investasi, trading, atau jenis lainnya yang diberikan atau didukung oleh TradingView. Baca selengkapnya di Ketentuan Penggunaan.