OPEN-SOURCE SCRIPT
Financial Astrology North Node (Rahu) Declination
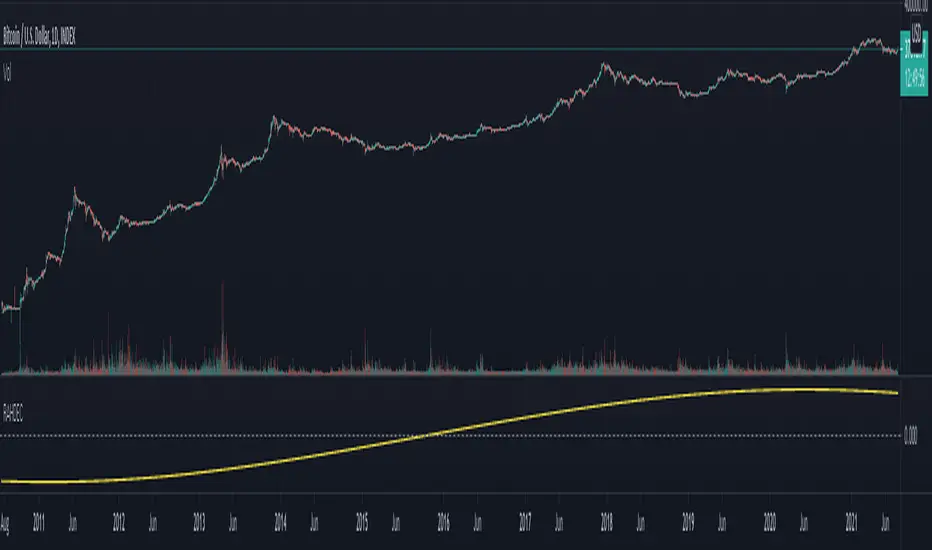
The North Node (Rahu) declination is a long term cycle so don't seem to provide useful pattern for short/mid term trading, however is interesting to note that when the declination was within -6 to +6 degrees the price was congested within narrow price zone. As observed in all planets declinations indicators the boundary of moving from North to South or viceversa is critical to determine trend change but in the case of the Moon Nodes it seems to show that the planets energy becomes in equilibrium which causes that price are more stable.
Note: The North Node (Rahu) declination indicator is based on an ephemeris array that covers years 2010 to 2030, prior or after this years the data is not available, this daily ephemeris are based on UTC time so in order to align properly with the price bars times you should set UTC as your chart timezone.
Note: The North Node (Rahu) declination indicator is based on an ephemeris array that covers years 2010 to 2030, prior or after this years the data is not available, this daily ephemeris are based on UTC time so in order to align properly with the price bars times you should set UTC as your chart timezone.
Skrip open-source
Dengan semangat TradingView yang sesungguhnya, pembuat skrip ini telah menjadikannya sebagai sumber terbuka, sehingga para trader dapat meninjau dan memverifikasi fungsinya. Salut untuk penulisnya! Meskipun Anda dapat menggunakannya secara gratis, perlu diingat bahwa penerbitan ulang kode ini tunduk pada Tata Tertib kami.
Pernyataan Penyangkalan
Informasi dan publikasi ini tidak dimaksudkan, dan bukan merupakan, saran atau rekomendasi keuangan, investasi, trading, atau jenis lainnya yang diberikan atau didukung oleh TradingView. Baca selengkapnya di Ketentuan Penggunaan.