OPEN-SOURCE SCRIPT
Dynamic Support and Resistance -AYNET
Explanation of the Code
Lookback Period:
The lookback input defines how many candles to consider when calculating the support (lowest low) and resistance (highest high).
Support and Resistance Calculation:
ta.highest(high, lookback) identifies the highest high over the last lookback candles.
ta.lowest(low, lookback) identifies the lowest low over the same period.
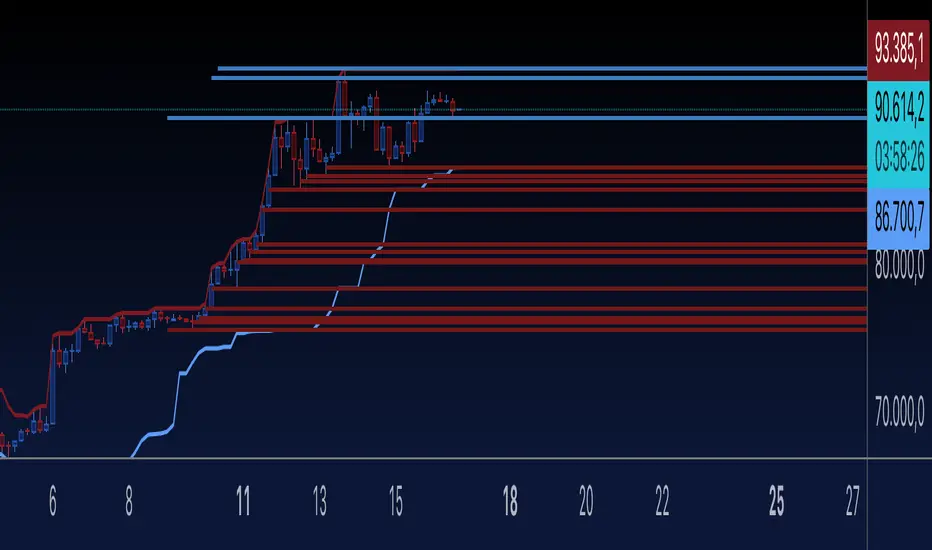
Dynamic Lines:
The line.new function creates yellow horizontal lines at the calculated support and resistance levels, extending them to the right.
Optional Plot:
plot is used to display the support and resistance levels as lines for visual clarity.
Customization:
You can adjust the lookback period and toggle the visibility of the lines via inputs.
How to Use This Code
Open the Pine Script Editor in TradingView.
Paste the above code into the editor.
Adjust the "Lookback Period for High/Low" to customize how the levels are calculated.
Enable or disable the support and resistance lines as needed.
This will create a chart similar to the one you provided, with horizontal yellow lines dynamically indicating the support and resistance levels. Let me know if you'd like any additional features or customizations!
Lookback Period:
The lookback input defines how many candles to consider when calculating the support (lowest low) and resistance (highest high).
Support and Resistance Calculation:
ta.highest(high, lookback) identifies the highest high over the last lookback candles.
ta.lowest(low, lookback) identifies the lowest low over the same period.
Dynamic Lines:
The line.new function creates yellow horizontal lines at the calculated support and resistance levels, extending them to the right.
Optional Plot:
plot is used to display the support and resistance levels as lines for visual clarity.
Customization:
You can adjust the lookback period and toggle the visibility of the lines via inputs.
How to Use This Code
Open the Pine Script Editor in TradingView.
Paste the above code into the editor.
Adjust the "Lookback Period for High/Low" to customize how the levels are calculated.
Enable or disable the support and resistance lines as needed.
This will create a chart similar to the one you provided, with horizontal yellow lines dynamically indicating the support and resistance levels. Let me know if you'd like any additional features or customizations!
Skrip open-source
Dengan semangat TradingView yang sesungguhnya, pembuat skrip ini telah menjadikannya sebagai sumber terbuka, sehingga para trader dapat meninjau dan memverifikasi fungsinya. Salut untuk penulisnya! Meskipun Anda dapat menggunakannya secara gratis, perlu diingat bahwa penerbitan ulang kode ini tunduk pada Tata Tertib kami.
Pernyataan Penyangkalan
Informasi dan publikasi ini tidak dimaksudkan, dan bukan merupakan, saran atau rekomendasi keuangan, investasi, trading, atau jenis lainnya yang diberikan atau didukung oleh TradingView. Baca selengkapnya di Ketentuan Penggunaan.