OPEN-SOURCE SCRIPT
High Volume Vector Candles
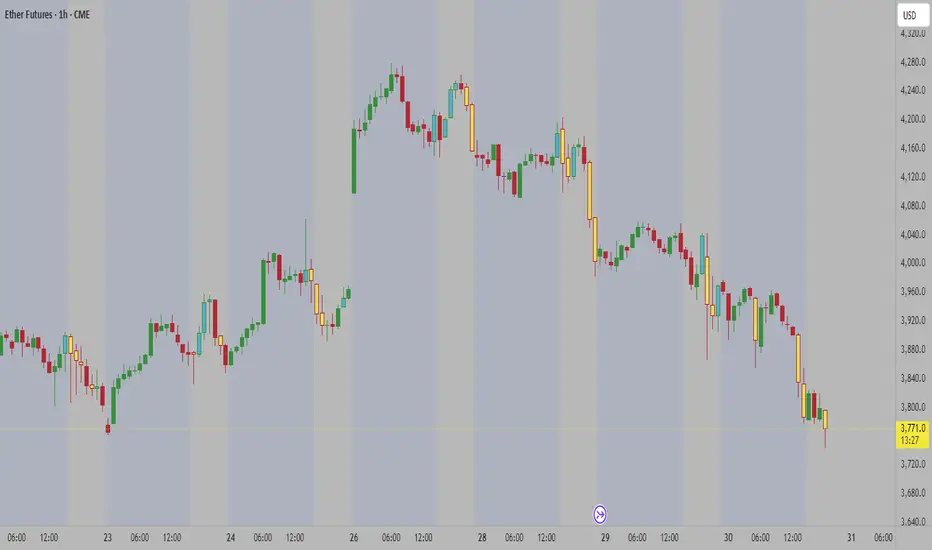
High Volume Vector Candles highlights candles where trading activity significantly exceeds the average, helping you quickly identify powerful moves driven by strong volume.
How it works:
- The script calculates a moving average of volume over a user-defined period.
- When current volume exceeds the chosen threshold (e.g. 150% of the average), the candle is marked as a high-volume event.
- Bullish high-volume candles are highlighted in blue tones, while bearish ones are shown in yellow, both with adjustable opacity.
This visualization makes it easier to spot potential breakout points, absorption zones, or institutional activity directly on your chart.
Customizable Settings:
• Moving average length
• Threshold percentage above average
• Bullish/Bearish highlight colors
• Opacity level
Ideal for traders who combine price action with volume analysis to anticipate market momentum.
Skrip open-source
Dengan semangat TradingView yang sesungguhnya, pembuat skrip ini telah menjadikannya sebagai sumber terbuka, sehingga para trader dapat meninjau dan memverifikasi fungsinya. Salut untuk penulisnya! Meskipun Anda dapat menggunakannya secara gratis, perlu diingat bahwa penerbitan ulang kode ini tunduk pada Tata Tertib kami.
Pernyataan Penyangkalan
Informasi dan publikasi ini tidak dimaksudkan, dan bukan merupakan, saran atau rekomendasi keuangan, investasi, trading, atau jenis lainnya yang diberikan atau didukung oleh TradingView. Baca selengkapnya di Ketentuan Penggunaan.