OPEN-SOURCE SCRIPT
Diupdate Hosoda N Wave and TPs {fmz}
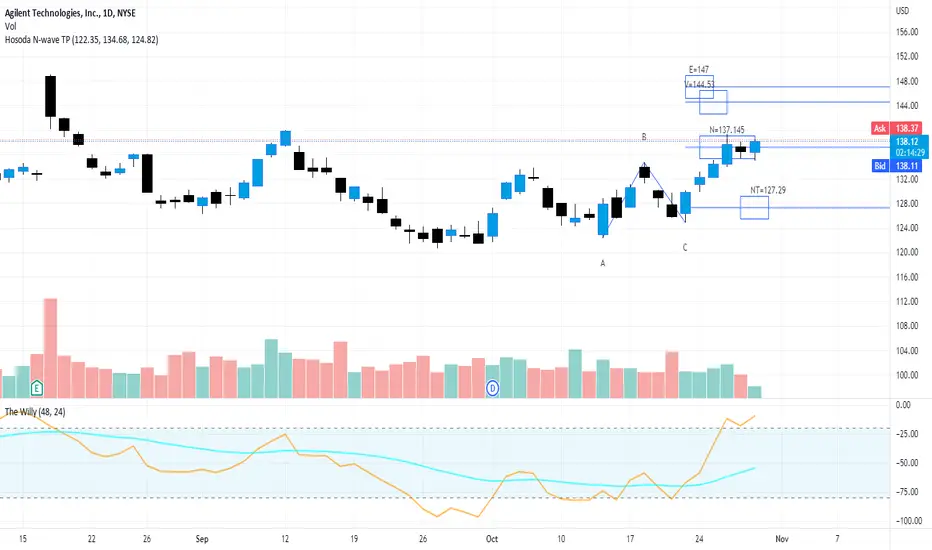
This script allows you to establish in a graphic and interactive way which are the N, NT, V and E targets for a Hosoda N wave.
Apply the indicator to the chart.
The interactive tool of Pine script version 5 will ask you to identify three points of "minimum-maximum-higher minimum" that form a bullish N wave of Hosoda (refer to the specific documentation for Hosoda N wave), or on the contrary three points "maximum-minimum-lower maximum" for a bearish N wave.
Once drawn, the price points can be moved.
When changing the market instrument, the indicator must be removed because it remains linked to the prices where it was first drawn.
Catatan Rilis
Thank to all guys that asked me to improve this script adding the time part of the theory.This new version allows from the moment in which the selected points ABC of the N wave are plotted to estimate where the objectives will be reached according to the Hosoda theory both in price and in time.
For the details of the calculation, see the references relating to the Nosoda N wave.
To use it you need to add it to the chart, the chart will ask you to choose three points (minimum-maximum minimum greater for a bullish trend, or maximum-minimum-maximum lower for a bearish trend) from which it will derive the possible targets for Hosoda.
Please check if it works well and report me in the comments if there are any problems, describing in detail the environment in which you are trying it in case you want to make reports.
Catatan Rilis
Restored lines on target with boolean to hide and show themCatatan Rilis
Conditional hide of Tp E date-time if BC>AC, the time target will be before point C. I'm curious about timing rule for choosing ABC point in Hosoda books, Anyone knows? Maybe we ave a AB time smaller than BC? So E target timing will be before C? Catatan Rilis
Allows to create a grid on time and price targets. Allows to trim horizontal lines to limit chart cluttering.Skrip open-source
Dengan semangat TradingView yang sesungguhnya, pembuat skrip ini telah menjadikannya sebagai sumber terbuka, sehingga para trader dapat meninjau dan memverifikasi fungsinya. Salut untuk penulisnya! Meskipun Anda dapat menggunakannya secara gratis, perlu diingat bahwa penerbitan ulang kode ini tunduk pada Tata Tertib kami.
Pernyataan Penyangkalan
Informasi dan publikasi ini tidak dimaksudkan, dan bukan merupakan, saran atau rekomendasi keuangan, investasi, trading, atau jenis lainnya yang diberikan atau didukung oleh TradingView. Baca selengkapnya di Ketentuan Penggunaan.
Skrip open-source
Dengan semangat TradingView yang sesungguhnya, pembuat skrip ini telah menjadikannya sebagai sumber terbuka, sehingga para trader dapat meninjau dan memverifikasi fungsinya. Salut untuk penulisnya! Meskipun Anda dapat menggunakannya secara gratis, perlu diingat bahwa penerbitan ulang kode ini tunduk pada Tata Tertib kami.
Pernyataan Penyangkalan
Informasi dan publikasi ini tidak dimaksudkan, dan bukan merupakan, saran atau rekomendasi keuangan, investasi, trading, atau jenis lainnya yang diberikan atau didukung oleh TradingView. Baca selengkapnya di Ketentuan Penggunaan.