OPEN-SOURCE SCRIPT
Diupdate Relative Strength Matrix
The Relative Strength Matrix (RSPS M) is a powerful comparison tool that analyzes and ranks up to 10 selected assets based on their relative performance. It does this by calculating price ratios between all asset pairs and applying a consistent strength criterion across each comparison. The results are displayed in a live-updating matrix, showing how each asset performs relative to the rest of the group.
By default, the indicator uses a momentum-based approach (via RSI) to evaluate strength, but it’s fully customizable. Users can modify the valuation logic by replacing the built-in ta.rsi function under the “Inputs your criterion below” section in the code. This makes the tool highly flexible—allowing for different styles of comparison such as trend-following, volatility-adjusted, or custom factor-based ranking methods.
Each asset’s total dominance score is color-coded and ranked, making it easy to spot outperformers and underperformers within any chosen basket. Whether you're tracking crypto pairs, sectors, or other groups, RSPS M provides a clear, objective framework for relative strength monitoring and rotation strategies—perfect for spotting leaders, laggards, and shifts in momentum across markets.
Catatan Rilis
The Relative Strength Matrix (RSPS M) is a powerful comparison tool that analyzes and ranks up to 10 selected assets based on their relative performance. It does this by calculating price ratios between all asset pairs and applying a consistent strength criterion across each comparison. The results are displayed in a live-updating matrix, showing how each asset performs relative to the rest of the group.By default, the indicator uses a momentum-based approach (via RSI) to evaluate strength, but it’s fully customizable. Users can modify the valuation logic by replacing the built-in ta.rsi function under the “Inputs your criterion below” section in the code (line 148). This makes the tool highly flexible—allowing for different styles of comparison such as trend-following, volatility-adjusted, or custom factor-based ranking methods.
Each asset’s total dominance score is color-coded and ranked, making it easy to spot outperformers and underperformers within any chosen basket. Whether you're tracking crypto pairs, sectors, or other groups, RSPS M provides a clear, objective framework for relative strength monitoring and rotation strategies—perfect for spotting leaders, laggards, and shifts in momentum across markets.
Catatan Rilis
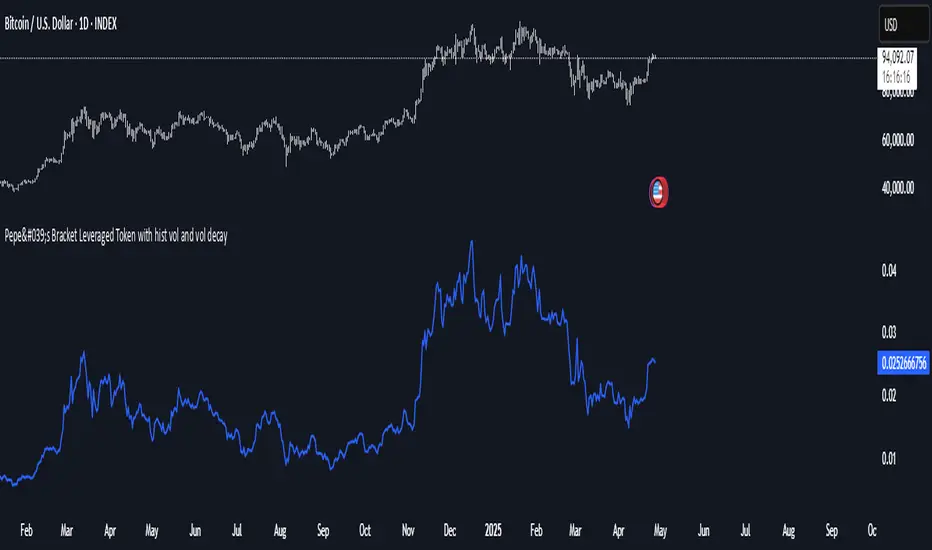
Updated imageCatatan Rilis
Made some changes so you can actually see the historical selection of the indicator and made the table/matrix more compact by removing "USD" or "USDT" and only using one digit after "."Again feel free to input your own criterion.
Enjoy.
Catatan Rilis
Updated visuals Catatan Rilis
Updated visuals Catatan Rilis
I dont know Catatan Rilis
Updating Skrip open-source
Dengan semangat TradingView yang sesungguhnya, pembuat skrip ini telah menjadikannya sebagai sumber terbuka, sehingga para trader dapat meninjau dan memverifikasi fungsinya. Salut untuk penulisnya! Meskipun Anda dapat menggunakannya secara gratis, perlu diingat bahwa penerbitan ulang kode ini tunduk pada Tata Tertib kami.
Pernyataan Penyangkalan
Informasi dan publikasi ini tidak dimaksudkan, dan bukan merupakan, saran atau rekomendasi keuangan, investasi, trading, atau jenis lainnya yang diberikan atau didukung oleh TradingView. Baca selengkapnya di Ketentuan Penggunaan.
Skrip open-source
Dengan semangat TradingView yang sesungguhnya, pembuat skrip ini telah menjadikannya sebagai sumber terbuka, sehingga para trader dapat meninjau dan memverifikasi fungsinya. Salut untuk penulisnya! Meskipun Anda dapat menggunakannya secara gratis, perlu diingat bahwa penerbitan ulang kode ini tunduk pada Tata Tertib kami.
Pernyataan Penyangkalan
Informasi dan publikasi ini tidak dimaksudkan, dan bukan merupakan, saran atau rekomendasi keuangan, investasi, trading, atau jenis lainnya yang diberikan atau didukung oleh TradingView. Baca selengkapnya di Ketentuan Penggunaan.