Universal Valuation Z_score -> PROFABIGHI_CAPITAL
The Universal Valuation Z-Score indicator provides a comprehensive multi-indicator valuation framework by computing Z-scores across momentum oscillators, volatility bands, and risk-adjusted metrics to assess over/undervaluation relative to historical norms. It weights these signals based on correlation strength with price, generates fair value estimates, and highlights extreme levels through color-coded candles and vertical bars for intuitive market positioning.
⚙️ General Settings
- Z-Score Lookback Period: Adjustable historical window for normalizing indicator deviations from mean
- Correlation Analysis Period: Timeframe for measuring indicator-price relationships and beta factors
- Show Threshold Lines: Toggle visibility of dynamic overbought/oversold boundaries on the chart
- Show Indicator Selection: Choose to display the composite average Z-score or a specific metric like RSI or Sharpe
- Use Price Weighting: Incorporate direct price Z-score into the final valuation blend
- Adaptive Weighting: Dynamically adjust indicator influence based on their correlation to price movements
📊 Barchoice Settings
- Overbought Threshold: Extreme upper level triggering vertical bar highlights for potential reversals
- Oversold Threshold: Extreme lower level signaling vertical bar alerts for buying opportunities
📈 RSI Configuration
- Enable RSI: Toggle inclusion of RSI Z-score in the weighted valuation
- RSI Source: Select the price input for momentum oscillation
- RSI Length: Period for calculating relative strength index deviations
📈 ROC Configuration
- Enable ROC: Include rate-of-change Z-score for momentum acceleration analysis
- ROC Period: Lookback for measuring percentage price shifts
📈 BB% Configuration
- Enable BB%: Factor in Bollinger Bands percentage Z-score for volatility positioning
- BB% Source: Data input for band-based normalization
- BB Length: Smoothing period for the central moving average
- BB Standard Deviation: Multiplier defining band width for extreme deviation detection
📈 CCI Configuration
- Enable CCI: Add Commodity Channel Index Z-score for cyclical deviation tracking
- CCI Source: Typical price or custom input for momentum extremes
- CCI Length: Period for typical price averaging and deviation
📈 Crosby Ratio Configuration
- Enable Crosby Ratio: Incorporate angle-based trend strength Z-score
- Crosby Length: Smoothing span for Heikin Ashi close and ATR comparison
📈 Sharpe Ratio Configuration
- Enable Sharpe Ratio: Include risk-adjusted return Z-score for efficiency weighting
- Sharpe Period: Window for return/volatility normalization
- Sharpe Smoothing: EMA length to stabilize efficiency readings
📈 Sortino Ratio Configuration
- Enable Sortino Ratio: Factor downside-focused efficiency Z-score
- Sortino Period: Historical scope for negative deviation analysis
- Risk-Free Rate: Benchmark yield subtracted from returns
- Sortino Smoothing: Filter for refined downside ratio
📈 Omega Ratio Configuration
- Enable Omega Ratio: Add probability-weighted gains/losses Z-score
- Omega Period: Lookback for return distribution evaluation
- Target Return: Threshold separating gains from losses
- Omega Smoothing: EMA to smooth ratio fluctuations
📏 Threshold Values
- Extreme Overbought Level: Upper Z-score boundary for strongest sell signals
- Extreme Oversold Level: Lower Z-score boundary for strongest buy signals
- Overbought Level: Moderate upper threshold for cautionary alerts
- Oversold Level: Moderate lower threshold for opportunity alerts
- Neutral Upper: Boundary separating fair value from slight overvaluation
- Neutral Lower: Boundary separating fair value from slight undervaluation
🎨 Color Settings
- Neutral Color: Default shade for balanced Z-score zones
- Overbought Color: Alert red for high valuation extremes
- Oversold Color: Alert green for low valuation extremes
- Neutral Upper Color: Subtle pink for mild overvaluation
- Neutral Lower Color: Subtle teal for mild undervaluation
- Light Overbought: Pale red for approaching overbought
- Light Oversold: Pale green for approaching oversold
- Zero Line Color: Gray reference for fair value centerline
📊 Valuation Calculation Methods
Z-Score Normalization:
- Computes standard deviations from historical means for each enabled indicator
- Standardizes diverse metrics into comparable deviation scores
- Handles insufficient data with null values for robustness
Correlation and Beta Analysis:
- Measures linear relationships between indicator Z-scores and price movements
- Calculates sensitivity (beta) for scaling deviations to price impact
- Uses rolling windows to capture evolving indicator relevance
Weighted Composite Formation:
- Applies equal or correlation-based weights to blend indicator Z-scores
- Incorporates price Z-score optionally for direct market alignment
- Adjusts via beta and absolute correlation for predictive strength
Fair Value Estimation:
- Derives mean price over lookback as central valuation anchor
- Projects expected price from composite Z-score and standard deviation
- Generates symmetric threshold bands at ±1, ±2, ±3 deviations
📈 Visual and Status Features
Z-Score Overlay Plot:
- Displays selected or average Z-score as a dynamic line on price chart
- Color gradients from neutral to extreme for instant valuation cues
- Zero line and threshold horizontals for reference boundaries
Candle Coloring:
- Tints bars based on Z-score zones for quick over/undervaluation scanning
- Applies to current bar only to avoid historical clutter
- Integrates with overlay for contextual price action review
Vertical Extreme Bars:
- Highlights bars where price wicks touch extreme Z-derived levels
- Semi-transparent backgrounds for non-intrusive alerts
- Combines price and Z-score conditions for dual confirmation
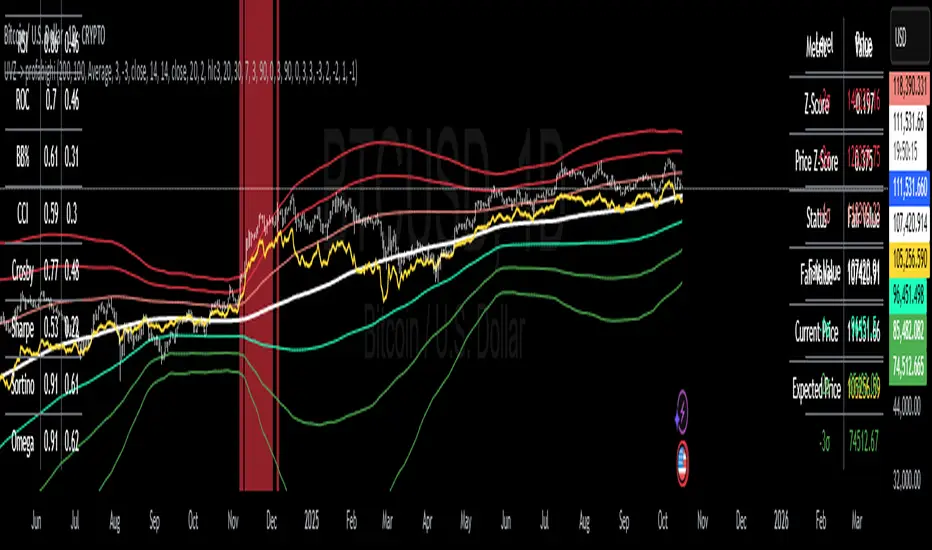
📋 Information Tables
Current Values Panel:
- Top-right summary of Z-score, price deviation, status, and fair value
- Color-codes entries matching the active Z-score zone
- Includes expected price projection for forward guidance
Correlation Matrix:
- Bottom-left grid showing indicator-price correlations and betas
- Rows for each metric with decimal precision for relationship strength
- Aids in understanding which signals drive valuation most
Price Levels Summary:
- Bottom-right ladder of Z-derived thresholds from -3 to +3 sigma
- Lists corresponding price levels for potential support/resistance
- Toggles with threshold display for integrated analysis
🔔 Alert System
- Overbought Crossover: Triggers when Z-score enters upper threshold zone
- Oversold Crossunder: Fires on Z-score dropping into lower threshold
- Price vs. Expectation Cross: Alerts on price diverging from indicator-derived target
- Extreme Wick Hits: Notifies when highs/lows breach far Z-boundaries
✅ Key Takeaways
- Holistic Valuation Tool: Blends multiple Z-scores for robust over/undervaluation signals
- Adaptive Intelligence: Correlation-weighted indicators prioritize price-relevant metrics
- Visual Simplicity: Color gradients, tables, and bars make complex analysis intuitive
- Customizable Depth: Toggle indicators and thresholds to fit any market or style
- Forward Projection: Expected prices guide targets beyond current fair value
- Risk-Aware Framework: Sharpe, Sortino, and Omega add efficiency layers to momentum
- Alert Precision: Zone crosses and wick extremes ensure timely notifications
Skrip hanya-undangan
Hanya pengguna yang disetujui oleh penulis yang dapat mengakses skrip ini. Anda harus meminta dan mendapatkan izin untuk menggunakannya. Izin ini biasanya diberikan setelah pembayaran. Untuk detail lebih lanjut, ikuti petunjuk penulis di bawah ini atau hubungi PROFABIGHI_CAPITAL secara langsung.
TradingView TIDAK menyarankan untuk membayar atau menggunakan skrip kecuali anda benar-benar percaya kepada pembuatnya dan memahami cara kerjanya. Anda juga dapat menemukan alternatif sumber terbuka yang gratis di skrip komunitas kami.
Instruksi penulis
Pernyataan Penyangkalan
Skrip hanya-undangan
Hanya pengguna yang disetujui oleh penulis yang dapat mengakses skrip ini. Anda harus meminta dan mendapatkan izin untuk menggunakannya. Izin ini biasanya diberikan setelah pembayaran. Untuk detail lebih lanjut, ikuti petunjuk penulis di bawah ini atau hubungi PROFABIGHI_CAPITAL secara langsung.
TradingView TIDAK menyarankan untuk membayar atau menggunakan skrip kecuali anda benar-benar percaya kepada pembuatnya dan memahami cara kerjanya. Anda juga dapat menemukan alternatif sumber terbuka yang gratis di skrip komunitas kami.