OPEN-SOURCE SCRIPT
Diupdate Critical Levels by Time Frame
Description
This indicator will help you present critical levels from a certain time frame.
Purpose and Usage
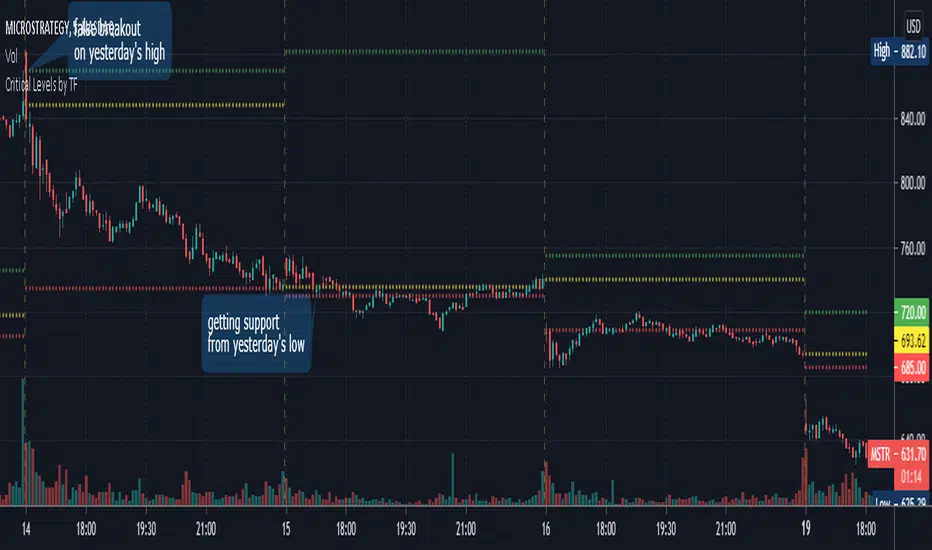
Many day traders are using the previous day high, close and low, as critical levels in their trading. in order to easily present those levels on your chart, I created this indicator in which you can define which of those you would like to present on your chart.
You may choose the best time frame for your needs, I suggest using the daily time frame which is also the default time frame, but you can use the weekly time frame to present the critical levels from the previous week, or you can choose any other time frame you would like.
Pre-market and after-market prices will not be taken into consideration.
Restrict to current DAY
There is an option to present the critical levels only today.
if you’re looking at a wide range of bars and don’t wanna present the critical levels among the entire chart, you may use this restriction to show a cleaner chart.
Filtering critical levels
To present only one or two critical levels (and not all three of them) you may use the style settings. uncheck any critical level that you’re not interested in.
I hope you enjoy this indicator and find it useful,
if you do, please like the script, and feel free to comment below.
Good luck with your trading.
This indicator will help you present critical levels from a certain time frame.
Purpose and Usage
Many day traders are using the previous day high, close and low, as critical levels in their trading. in order to easily present those levels on your chart, I created this indicator in which you can define which of those you would like to present on your chart.
You may choose the best time frame for your needs, I suggest using the daily time frame which is also the default time frame, but you can use the weekly time frame to present the critical levels from the previous week, or you can choose any other time frame you would like.
Pre-market and after-market prices will not be taken into consideration.
Restrict to current DAY
There is an option to present the critical levels only today.
if you’re looking at a wide range of bars and don’t wanna present the critical levels among the entire chart, you may use this restriction to show a cleaner chart.
Filtering critical levels
To present only one or two critical levels (and not all three of them) you may use the style settings. uncheck any critical level that you’re not interested in.
I hope you enjoy this indicator and find it useful,
if you do, please like the script, and feel free to comment below.
Good luck with your trading.
Catatan Rilis
Fixed minor bug with last barSkrip open-source
Dengan semangat TradingView yang sesungguhnya, pembuat skrip ini telah menjadikannya sebagai sumber terbuka, sehingga para trader dapat meninjau dan memverifikasi fungsinya. Salut untuk penulisnya! Meskipun Anda dapat menggunakannya secara gratis, perlu diingat bahwa penerbitan ulang kode ini tunduk pada Tata Tertib kami.
Pernyataan Penyangkalan
Informasi dan publikasi ini tidak dimaksudkan, dan bukan merupakan, saran atau rekomendasi keuangan, investasi, trading, atau jenis lainnya yang diberikan atau didukung oleh TradingView. Baca selengkapnya di Ketentuan Penggunaan.
Skrip open-source
Dengan semangat TradingView yang sesungguhnya, pembuat skrip ini telah menjadikannya sebagai sumber terbuka, sehingga para trader dapat meninjau dan memverifikasi fungsinya. Salut untuk penulisnya! Meskipun Anda dapat menggunakannya secara gratis, perlu diingat bahwa penerbitan ulang kode ini tunduk pada Tata Tertib kami.
Pernyataan Penyangkalan
Informasi dan publikasi ini tidak dimaksudkan, dan bukan merupakan, saran atau rekomendasi keuangan, investasi, trading, atau jenis lainnya yang diberikan atau didukung oleh TradingView. Baca selengkapnya di Ketentuan Penggunaan.