OPEN-SOURCE SCRIPT
Pipe tops & bottoms v1.0
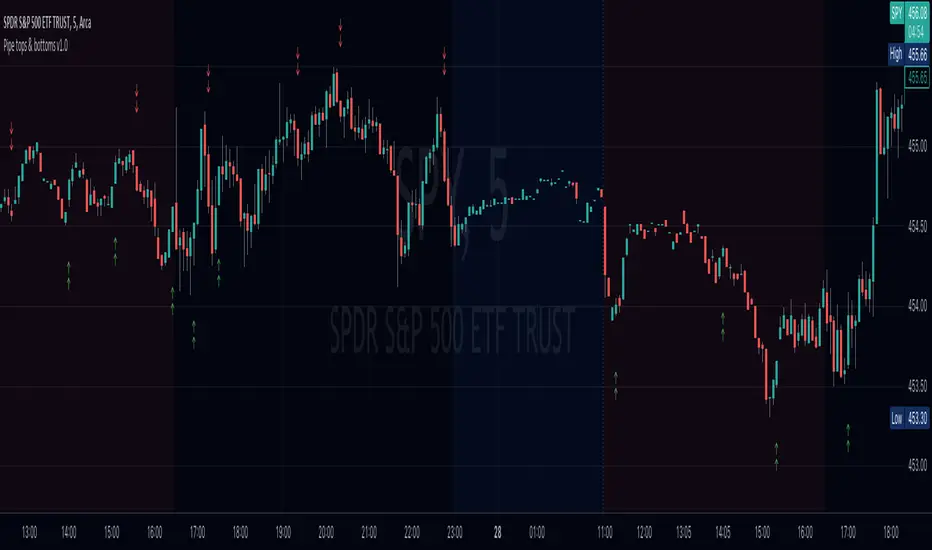
This indicator detects Pipe Tops and Pipe Bottoms chart patterns, using the concept described by Thomas Bulkowski: Tops, Bottoms.
Pipe tops and bottoms patterns are marked on the chart. You can change the indicator sensitivity by using the main settings which define detected price variation boundaries. This will lead to more dense or sparse pattern detection.
Once the bar following each detected top or bottom pattern satisfies signal condition (the current close price must be higher than the high of the pipe bottom, or lower than the low of the pipe top), these bars are also marked on the chart and can be used to define potential long or short entry points.
You can optionally choose to show only signal marks on the chart (this is preferable to avoid visual cluttering), or both pattern and signal marks.
Script calculations are based on the 'Pipe Bottoms Indicator Based on Thomas Bulkowski's Theories' indicator developed by BoilderRoomColdCaller in 2020.
Skrip open-source
Dengan semangat TradingView yang sesungguhnya, pembuat skrip ini telah menjadikannya sebagai sumber terbuka, sehingga para trader dapat meninjau dan memverifikasi fungsinya. Salut untuk penulisnya! Meskipun Anda dapat menggunakannya secara gratis, perlu diingat bahwa penerbitan ulang kode ini tunduk pada Tata Tertib kami.
Pernyataan Penyangkalan
Informasi dan publikasi ini tidak dimaksudkan, dan bukan merupakan, saran atau rekomendasi keuangan, investasi, trading, atau jenis lainnya yang diberikan atau didukung oleh TradingView. Baca selengkapnya di Ketentuan Penggunaan.