OPEN-SOURCE SCRIPT
MAGIC MA BANDS
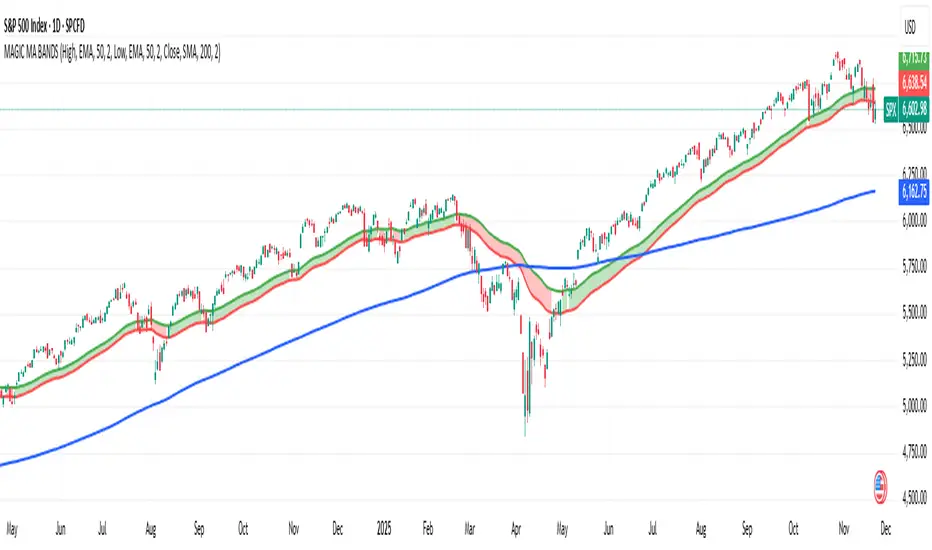
Magic MA Bands — Dynamic Trend Zones Instead of Lines
Magic MA Bands help traders visualize dynamic support and resistance zones rather than relying on a single moving average line. Instead of treating the MA as an exact reaction level, this tool creates a band or zone where price is statistically more likely to react, reverse, or continue trending.
🧠 How It Works
The script plots:
Upper Band (default: 50 EMA using High values)
Lower Band (default: 50 EMA using Low values)
Optional Midline MA (default: 200 SMA for long-term trend)
The area between the upper and lower bands becomes a trend cushion, helping traders identify:
Dynamic support/resistance zones
Trend strength and continuation probability
Ideal pullback entry regions
🎯 Trend Interpretation Guide
Use Case Recommended Setting
Short-Term Trend 20/21 EMA or SMA
Medium-Term Trend 50 EMA / SMA
Long-Term Trend 200 SMA / EMA (Midline Optional)
All parameters are fully customisable so the user can define their preferred structure based on their trading style, asset volatility, or timeframe.
✔️ Best For:
Trend traders
Swing trading
Pullback-based entries
Institutional-style zone analysis
Skrip open-source
In true TradingView spirit, the creator of this script has made it open-source, so that traders can review and verify its functionality. Kudos to the author! While you can use it for free, remember that republishing the code is subject to our House Rules.
Pernyataan Penyangkalan
The information and publications are not meant to be, and do not constitute, financial, investment, trading, or other types of advice or recommendations supplied or endorsed by TradingView. Read more in the Terms of Use.