OPEN-SOURCE SCRIPT
Diupdate ATR-Based Suitability Checker
Purpose:
Key Features:
How to Use:
Input Parameters:
Who Should Use This:
Notes:
This indicator helps traders identify the most suitable timeframe for trading by comparing fees to market volatility (ATR). Instead of filtering out specific assets or strategies, it focuses on finding optimal trading conditions for the selected timeframe. It is designed to adapt dynamically, ensuring that traders can align their approach with the current market environment.
Key Features:
- Dynamic ATR Analysis: Measures volatility using the Average True Range (ATR) and evaluates how fees impact potential profitability across timeframes.
- Fee-to-ATR Ratio: Calculates the proportion of fees to ATR, highlighting conditions where fees are too large relative to price movements.
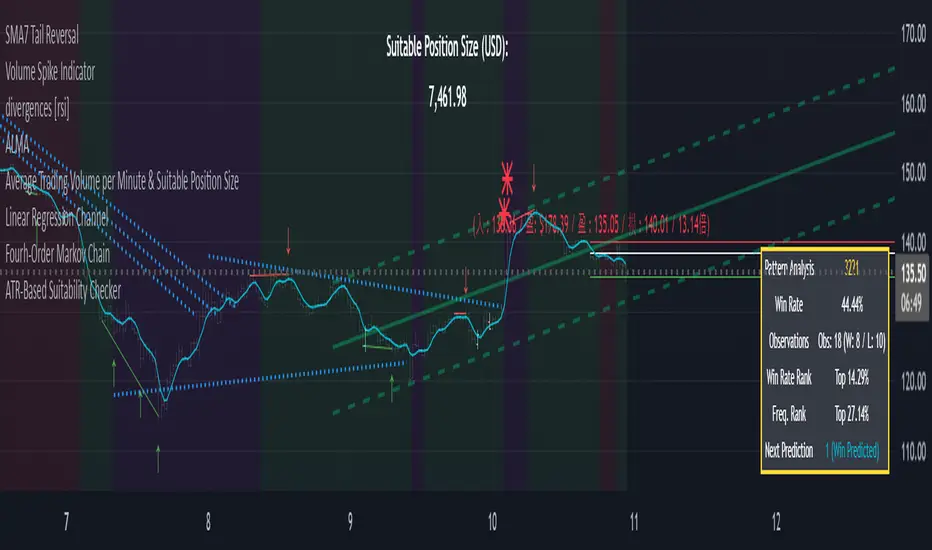
- Visual Feedback: **Red Background:** Indicates unsuitable trading conditions where fees dominate. **Green Background:** Highlights suitable conditions for trading efficiency. Markers provide quick visual identification of suitability.
- Custom Transparency: Enables users to adjust the background’s transparency for better chart visibility.
How to Use:
- Timeframe Optimization: When volatility rises, price movements become larger, making shorter timeframes more suitable for trading. Conversely, during periods of low volatility, longer timeframes are preferable to avoid overtrading within a narrow price range.
- Spot & Leverage Trading: For spot trading, this tool identifies conditions where fees (e.g., 0.25%-0.3%) might excessively impact profitability. For instance, if ATR is comparable to fees, the trading environment may not be ideal. In leveraged trading, the indicator helps assess whether the current volatility supports your chosen leverage level, ensuring that leverage does not amplify undue risks.
- Efficiency Focus: The indicator emphasizes finding a balance between market conditions and your trading strategy. Not all timeframes need to be "suitable" at all times; instead, it highlights the best opportunities based on current market dynamics. Utilize the suitability ratio across different timeframes to guide and adjust your trading strategies effectively.
Input Parameters:
- ATR Length: Defines the period for ATR calculation (default: 14).
- Fee Percentage (%): Trading fee as a percentage of the closing price (default: 0.1%).
- Unsuitable Threshold (% of 1 ATR): Sets the maximum acceptable fee-to-ATR ratio for suitable conditions (default: 20%).
- Background Transparency (0-100): Adjusts the opacity of the background highlight (default: 80).
Who Should Use This:
- This tool is ideal for traders seeking to align their strategy with market conditions by finding the most suitable timeframe. It applies to both spot and leveraged markets, helping optimize efficiency while managing fees and volatility.
Notes:
- The ATR-Based Suitability Checker is a supplementary tool. Combine it with other forms of analysis for comprehensive decision-making.
- Regularly adjust the parameters to match your trading preferences and market conditions.
Catatan Rilis
unsuitableThreshold =15Catatan Rilis
unsuitableThreshold is now 8%. Catatan Rilis
unsuitableThreshold = input.float(10, minval=1, title="Unsuitable Threshold (% of 1 ATR)") / 100Catatan Rilis
bgTransparency = input.int(90, minval=0, maxval=100, title="Background Transparency (0-100)")Catatan Rilis
unsuitableThreshold = input.float(8, minval=1, title="Unsuitable Threshold (% of 1 ATR)") / 100Catatan Rilis
unsuitableThreshold = input.float(6.5, minval=1.0, title="Unsuitable Threshold (% of 1 ATR)") / 100Catatan Rilis
unsuitableThreshold = input.float(8.2, minval=1.0, title="Unsuitable Threshold (% of 1 ATR)") / 100Catatan Rilis
- New Feature (Yellow Background):
The script now highlights periods of high volatility with a yellow background. This occurs when the fee-to-ATR ratio is below half of the unsuitable threshold (e.g., < 4.1% when the multiplier is 2). This addition helps identify when market conditions are too volatile for optimal trading, complementing the existing red (low volatility) and green (suitable volatility) backgrounds.
Catatan Rilis
color.purple highVolMultiplier = input.float(1.74, minval=1.0, title="High Volatility Multiplier (x normal)") Catatan Rilis
unsuitableThreshold = input.float(9.0, minval=1.0, title="Unsuitable Low Volatility Threshold (% of 1 ATR)") / 100Catatan Rilis
asdSkrip open-source
Dengan semangat TradingView yang sesungguhnya, pembuat skrip ini telah menjadikannya sebagai sumber terbuka, sehingga para trader dapat meninjau dan memverifikasi fungsinya. Salut untuk penulisnya! Meskipun Anda dapat menggunakannya secara gratis, perlu diingat bahwa penerbitan ulang kode ini tunduk pada Tata Tertib kami.
Pernyataan Penyangkalan
Informasi dan publikasi ini tidak dimaksudkan, dan bukan merupakan, saran atau rekomendasi keuangan, investasi, trading, atau jenis lainnya yang diberikan atau didukung oleh TradingView. Baca selengkapnya di Ketentuan Penggunaan.
Skrip open-source
Dengan semangat TradingView yang sesungguhnya, pembuat skrip ini telah menjadikannya sebagai sumber terbuka, sehingga para trader dapat meninjau dan memverifikasi fungsinya. Salut untuk penulisnya! Meskipun Anda dapat menggunakannya secara gratis, perlu diingat bahwa penerbitan ulang kode ini tunduk pada Tata Tertib kami.
Pernyataan Penyangkalan
Informasi dan publikasi ini tidak dimaksudkan, dan bukan merupakan, saran atau rekomendasi keuangan, investasi, trading, atau jenis lainnya yang diberikan atau didukung oleh TradingView. Baca selengkapnya di Ketentuan Penggunaan.