OPEN-SOURCE SCRIPT
Diupdate Short Volume % of Total Volume
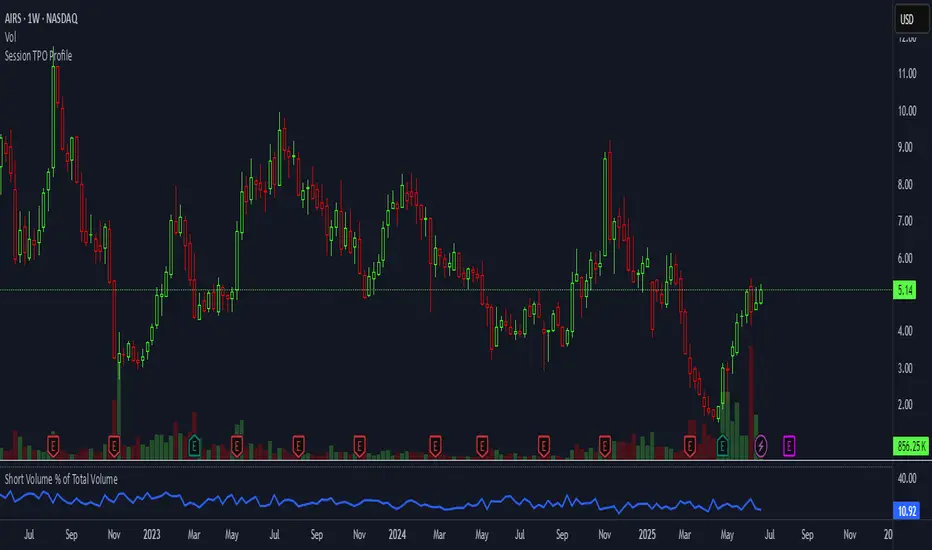
Short Volume % of Total Volume
This indicator plots the daily short volume as a percentage of total volume for a specific U.S. stock. The short volume is sourced from FINRA’s reported short sale data and is compared against the stock’s total trading volume for the same day.
📊 Use Cases:
Monitor short-selling pressure over time.
Identify spikes in short volume % that may signal increased bearish positioning.
Use in conjunction with price action to gauge sentiment shifts or potential short squeezes.
⚠️ Note: FINRA data reflects activity from FINRA-regulated trading venues only and may not represent full market-wide short activity.
Catatan Rilis
Short Volume % of Total VolumeThis indicator plots the daily short volume as a percentage of total volume for a specific U.S. stock. The short volume is sourced from FINRA’s reported short sale data and is compared against the stock’s total trading volume for the same day.
📌 Key Features:
Pulls FINRA short volume data (FINRA:[TICKER]_SHORT_VOLUME)
Calculates short volume as a percentage of daily total volume
Includes a 50% reference line to help spot above-average shorting activity
Updates daily but displays on any chart timeframe
📊 Use Cases:
Monitor short-selling pressure over time
Identify spikes in short volume % that may signal increased bearish positioning
Use in conjunction with price action to gauge sentiment shifts or potential short squeezes
⚠️ Note: FINRA data reflects activity from FINRA-regulated trading venues only and may not represent full market-wide short activity.
Skrip open-source
Dengan semangat TradingView yang sesungguhnya, pembuat skrip ini telah menjadikannya sebagai sumber terbuka, sehingga para trader dapat meninjau dan memverifikasi fungsinya. Salut untuk penulisnya! Meskipun Anda dapat menggunakannya secara gratis, perlu diingat bahwa penerbitan ulang kode ini tunduk pada Tata Tertib kami.
Pernyataan Penyangkalan
Informasi dan publikasi ini tidak dimaksudkan, dan bukan merupakan, saran atau rekomendasi keuangan, investasi, trading, atau jenis lainnya yang diberikan atau didukung oleh TradingView. Baca selengkapnya di Ketentuan Penggunaan.