OPEN-SOURCE SCRIPT
FIB vs HL
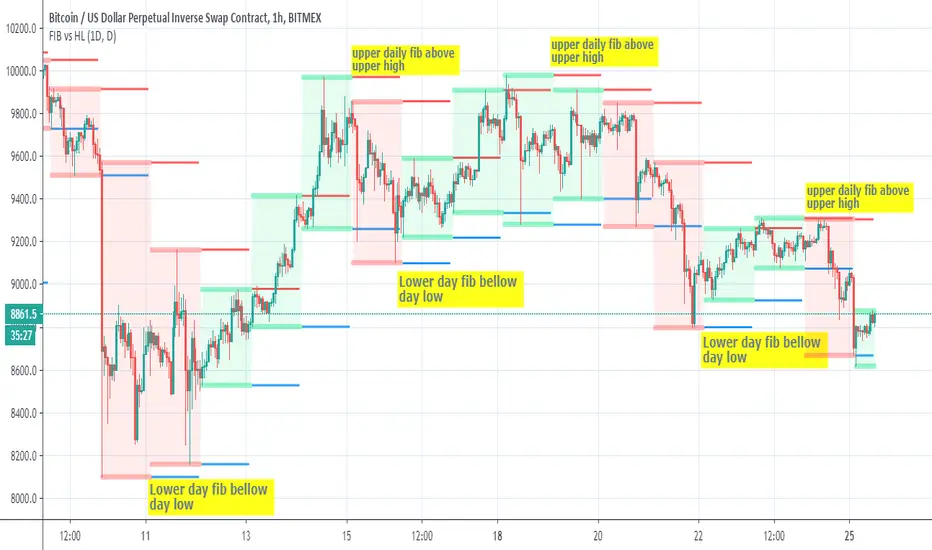
This script show the relation bettwen daily fib seen in red =upper and blue=lower to daily candles upper and lower
since there is slight variation how both calculated we can see that when daily fib is lower then the low candles daily low then there is a good chance for a buy trend
and vice versa in oposite direction
so it just a nice idea that need further verification
since there is slight variation how both calculated we can see that when daily fib is lower then the low candles daily low then there is a good chance for a buy trend
and vice versa in oposite direction
so it just a nice idea that need further verification
Skrip open-source
Dengan semangat TradingView yang sesungguhnya, pembuat skrip ini telah menjadikannya sebagai sumber terbuka, sehingga para trader dapat meninjau dan memverifikasi fungsinya. Salut untuk penulisnya! Meskipun Anda dapat menggunakannya secara gratis, perlu diingat bahwa penerbitan ulang kode ini tunduk pada Tata Tertib kami.
Pernyataan Penyangkalan
Informasi dan publikasi ini tidak dimaksudkan, dan bukan merupakan, saran atau rekomendasi keuangan, investasi, trading, atau jenis lainnya yang diberikan atau didukung oleh TradingView. Baca selengkapnya di Ketentuan Penggunaan.