OPEN-SOURCE SCRIPT
Stefan Krecher: Jeddingen Divergence
The main idea is to identify a divergence between momentum and price movement. E.g. if the momentum is rising but price is going down - this is what we call a divergence. The divergence will be calculated by comparing the direction of the linear regression curve of the price with the linear regression curve of momentum.
A bearish divergence can be identified by a thick red line, a bullish divergence by a green line.
When there is a divergence, it is likeley that the current trend will change it's direction.
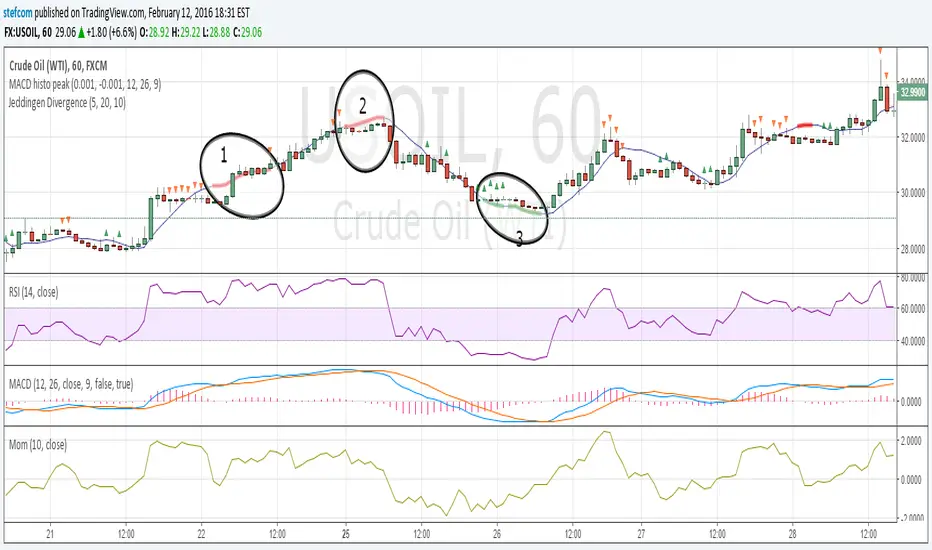
Looking at the chart, there are three divergences that need to get interpreted:
1) bearish divergence, RSI is overbought but MACD does not clearly indicate a trend change. Right after the divergence, price and momentum are going up. No clear signal for a sell trade
2) bearish divergence, RSI still overbought, MACD histogram peaked, MACD crossed the signal line, price and momentum are going down. Very clear constellation for a sell trade.
3) two bullish diverences, RSI is oversold, MACD crossover near the end of the second divergence, price and momentum started rising. Good constellation for a buy trade. Could act as exit signal for the beforementioned sell trade.
More information on the Jeddingen Divergence is available here: https://www.forexpython.com/strategy
A bearish divergence can be identified by a thick red line, a bullish divergence by a green line.
When there is a divergence, it is likeley that the current trend will change it's direction.
Looking at the chart, there are three divergences that need to get interpreted:
1) bearish divergence, RSI is overbought but MACD does not clearly indicate a trend change. Right after the divergence, price and momentum are going up. No clear signal for a sell trade
2) bearish divergence, RSI still overbought, MACD histogram peaked, MACD crossed the signal line, price and momentum are going down. Very clear constellation for a sell trade.
3) two bullish diverences, RSI is oversold, MACD crossover near the end of the second divergence, price and momentum started rising. Good constellation for a buy trade. Could act as exit signal for the beforementioned sell trade.
More information on the Jeddingen Divergence is available here: https://www.forexpython.com/strategy
Skrip open-source
Dengan semangat TradingView yang sesungguhnya, penulis skrip ini telah menjadikannya sumber terbuka, sehingga para trader dapat meninjau dan memverifikasi fungsinya. Hormat untuk penulisnya! Meskipun anda dapat menggunakannya secara gratis, ingatlah bahwa penerbitan ulang kode tersebut tunduk pada Tata Tertib kami.
⚡ ProDivergence buy.stripe.com/3cs14e15h6FiaBy6oo
⚡ ProTrend buy.stripe.com/4gweV49BN5Be4da8wx
⚡ GET THE CCIDivergence STUDY FOR FREE: bit.ly/CCIDivFree
⚡ ProTrend buy.stripe.com/4gweV49BN5Be4da8wx
⚡ GET THE CCIDivergence STUDY FOR FREE: bit.ly/CCIDivFree
Pernyataan Penyangkalan
Informasi dan publikasi tidak dimaksudkan untuk menjadi, dan bukan merupakan saran keuangan, investasi, perdagangan, atau rekomendasi lainnya yang diberikan atau didukung oleh TradingView. Baca selengkapnya di Persyaratan Penggunaan.