OPEN-SOURCE SCRIPT
Diupdate Call and Put by Powerful Trading
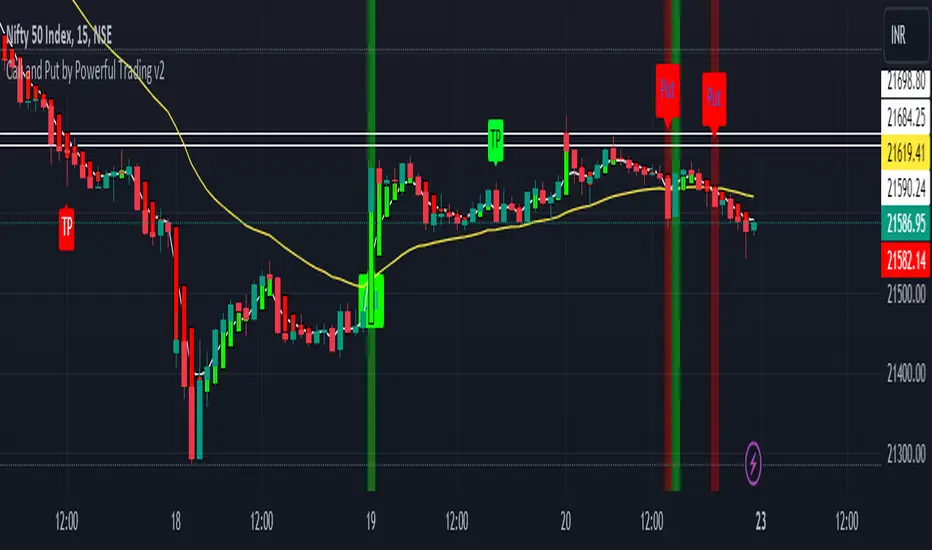
This script attempts to use Exponential Moving averages (short-term and long-term convergence) of different lengths in order to identify trade entries and exits for bullish & bearish trades. I would strongly recommend using it on Bank nifty , Nifty 50 .https://www.tradingview.com/x/P71QZJEd/ You use this script by entering a trade when it signals a green CALL signal with a UP label and exiting when it signals red put signal. The general idea is that one is fast and one is slow-moving EMA and these indicate when to buy/sell when they crossover the overbought/sold lines.
It also provides a vertical line with green and red color , when short ema is over it shows green vertical line and when short ema is below it provides red vertical line.
Best for bank nifty on 15 mins chart
It also provides a vertical line with green and red color , when short ema is over it shows green vertical line and when short ema is below it provides red vertical line.
Best for bank nifty on 15 mins chart
Catatan Rilis
If you don't understand when to exit we have added crosses on chart.Plus now you can identify the trends with the help of Heikin ashi candle shown with the normal chart.
Also wrong signals given have been fixed.
Now it seems best to trade on any charts and anytime frame
Suggested time frame 2 hours char and 15 mins chart
Works best with banknifty , forex and btcusd now.
Catatan Rilis
New update -Alerts added
Best settings already given for 15 mins
Now settings can be taken till 1
Take profit added with SMI calculations.
To use this updated chart , remove and re add the indicator.
Skrip open-source
Dengan semangat TradingView yang sesungguhnya, pembuat skrip ini telah menjadikannya sebagai sumber terbuka, sehingga para trader dapat meninjau dan memverifikasi fungsinya. Salut untuk penulisnya! Meskipun Anda dapat menggunakannya secara gratis, perlu diingat bahwa penerbitan ulang kode ini tunduk pada Tata Tertib kami.
Pernyataan Penyangkalan
Informasi dan publikasi ini tidak dimaksudkan, dan bukan merupakan, saran atau rekomendasi keuangan, investasi, trading, atau jenis lainnya yang diberikan atau didukung oleh TradingView. Baca selengkapnya di Ketentuan Penggunaan.