PROTECTED SOURCE SCRIPT
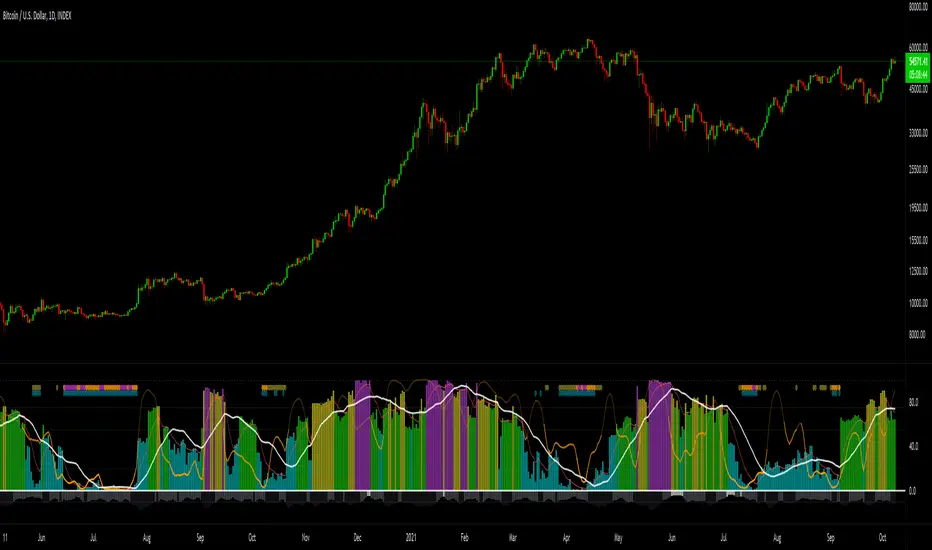
Diupdate Borjas Tarh Explosive Pivots

Borjas Tarh Explosive Pivots
This indicator includes:
1. Historical Volatility Percentile (HVP) +SMA+EMA
Core Idea (balipour):
HVP Code Help (semiotic): tradingview.com/u/semiotic
For the Detailed Description read the Core (HVP) Idea indicator by "balipour" above.
2. Bollinger Bands Width (BBW)
It's an Oscillation of BBW So it's trapped between 0 to 100. (And Lightly Smoothed)
3. Volume Oscillator
The Volume is oscillated so it's trapped between 0 and -30. (And Lightly Smoothed)
Below 10 Means the Volume in the context of the Candle Volume is pretty low.
4. The Shapes
These Shapes are based of all factors above.
D (Blue) : HVPis pretty Low. An Explosive Move is Coming.
A (Yellow) : An Explosive Move is Building Up.
B (Orange) : An Explosive Move is Near.
C (Purple) : An Explosive Move Will Happen Very Soon.
There is an Alternative Set:
On = Annual HVP and Default BBW.
Off = Fibonacci HVP and BBW.
© mrhashem
© Borjas Tarh Company
This indicator includes:
1. Historical Volatility Percentile (HVP) +SMA+EMA
Core Idea (balipour):

HVP Code Help (semiotic): tradingview.com/u/semiotic
For the Detailed Description read the Core (HVP) Idea indicator by "balipour" above.
2. Bollinger Bands Width (BBW)
It's an Oscillation of BBW So it's trapped between 0 to 100. (And Lightly Smoothed)
3. Volume Oscillator
The Volume is oscillated so it's trapped between 0 and -30. (And Lightly Smoothed)
Below 10 Means the Volume in the context of the Candle Volume is pretty low.
4. The Shapes
These Shapes are based of all factors above.
D (Blue) : HVPis pretty Low. An Explosive Move is Coming.
A (Yellow) : An Explosive Move is Building Up.
B (Orange) : An Explosive Move is Near.
C (Purple) : An Explosive Move Will Happen Very Soon.
There is an Alternative Set:
On = Annual HVP and Default BBW.
Off = Fibonacci HVP and BBW.
© mrhashem
© Borjas Tarh Company
Catatan Rilis
Settings Updated.Catatan Rilis
Style Update.Catatan Rilis
Added 2 types of Smoothing:Options:
No Smoothing
Lite Smoothing
Heavy Smoothing
Source Update. Code Tweaks.
Catatan Rilis
Updated BBW Formula.Updated Code Styling.
Catatan Rilis
Updated to v5 Pinescript.Skrip terproteksi
Skrip ini diterbitkan sebagai sumber tertutup. However, you can use it freely and without any limitations – learn more here.
Pernyataan Penyangkalan
The information and publications are not meant to be, and do not constitute, financial, investment, trading, or other types of advice or recommendations supplied or endorsed by TradingView. Read more in the Terms of Use.
Skrip terproteksi
Skrip ini diterbitkan sebagai sumber tertutup. However, you can use it freely and without any limitations – learn more here.
Pernyataan Penyangkalan
The information and publications are not meant to be, and do not constitute, financial, investment, trading, or other types of advice or recommendations supplied or endorsed by TradingView. Read more in the Terms of Use.