OPEN-SOURCE SCRIPT
Reductionism candle chart
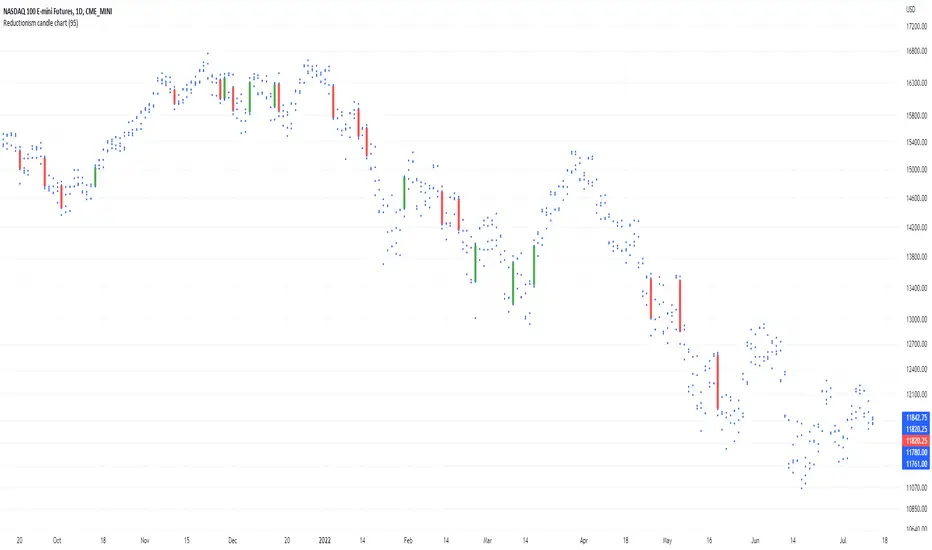
Here I am introducing "Reductionism candle chart", in most of the case takeing away those distracting "candles", and also remaining the most of data (4 dots) for each index on the chart.
And only keeping high valuation change "price gap" filled up with candles.
For someone who don't relies on candles to their decision. Usually candles are redundant to them.
For someone who uses candle, definitely not all candles are carrying the same amount of information.
Most often less is more, in terms of representing the thing that is not related to your model.
This script the color and the volatility boundary are changeable, so no additional coding is required to use it.
Enjoy :)
Skrip open-source
Dengan semangat TradingView yang sesungguhnya, pembuat skrip ini telah menjadikannya sebagai sumber terbuka, sehingga para trader dapat meninjau dan memverifikasi fungsinya. Salut untuk penulisnya! Meskipun Anda dapat menggunakannya secara gratis, perlu diingat bahwa penerbitan ulang kode ini tunduk pada Tata Tertib kami.
Pernyataan Penyangkalan
Informasi dan publikasi ini tidak dimaksudkan, dan bukan merupakan, saran atau rekomendasi keuangan, investasi, trading, atau jenis lainnya yang diberikan atau didukung oleh TradingView. Baca selengkapnya di Ketentuan Penggunaan.