PROTECTED SOURCE SCRIPT
Diupdate xGhozt Wickless Candle Streak Probability
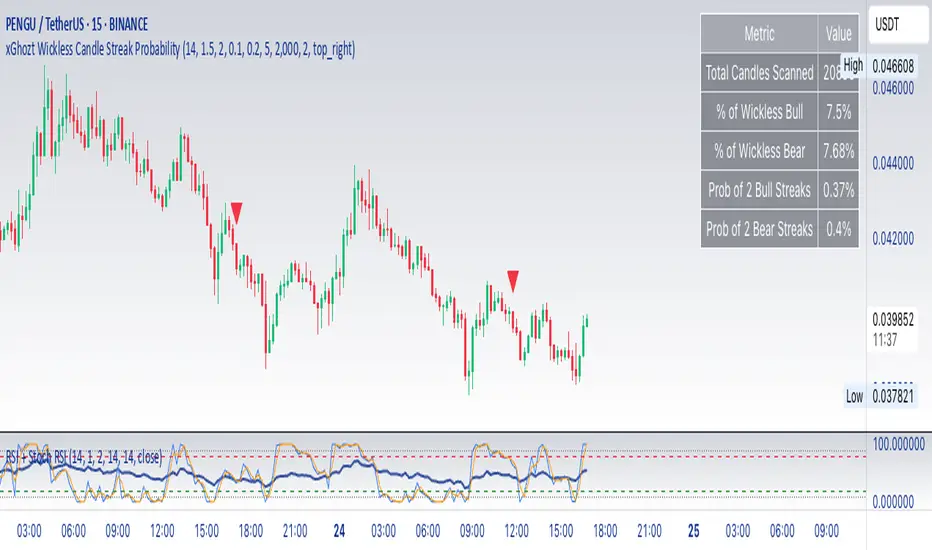
The xGhozt Wickless Candle Streak Probability is a custom Pine Script indicator designed to identify and quantify the occurrence of consecutive "wickless" candles of the same trend (either bullish or bearish).
Key Features:
Wickless Candle Detection: It first identifies candles that lack an upper or lower wick (meaning their open/close is equal to their high/low, respectively).
Consecutive Streak Tracking: The indicator tracks how many wickless bullish candles occur in a row, and similarly for wickless bearish candles.
User-Defined Streak Length: You can specify a Streak Length in the indicator's settings. This defines how many consecutive wickless candles are needed to register a "streak."
Probability Calculation: For the chosen Streak Length, the indicator calculates the historical probability (as a percentage) of encountering such a streak for both bullish and bearish wickless candles. This is done by dividing the number of times a streak of that length has occurred by the total number of candles scanned.
On-Chart Display: The results, including the total wickless candles, total scanned candles, and the calculated streak probabilities, are displayed in a convenient table directly on your chart.
Purpose:
This indicator helps traders and analysts understand the historical likelihood of sustained, strong directional moves as indicated by consecutive wickless candles. By quantifying these probabilities, it can provide insights into potential continuation patterns or extreme market conditions, which might be useful for developing trading strategies or confirming market biases.
Catatan Rilis
changed the label iconsCatatan Rilis
updated numbers tableCatatan Rilis
updated odds calculationsCatatan Rilis
Cleaner chart, smaller labelsCatatan Rilis
Aesthetics changesSkrip terproteksi
Skrip ini diterbitkan sebagai sumber tertutup. Namun, Anda dapat menggunakannya dengan bebas dan tanpa batasan apa pun – pelajari lebih lanjut di sini.
Pernyataan Penyangkalan
Informasi dan publikasi ini tidak dimaksudkan, dan bukan merupakan, saran atau rekomendasi keuangan, investasi, trading, atau jenis lainnya yang diberikan atau didukung oleh TradingView. Baca selengkapnya di Ketentuan Penggunaan.
Skrip terproteksi
Skrip ini diterbitkan sebagai sumber tertutup. Namun, Anda dapat menggunakannya dengan bebas dan tanpa batasan apa pun – pelajari lebih lanjut di sini.
Pernyataan Penyangkalan
Informasi dan publikasi ini tidak dimaksudkan, dan bukan merupakan, saran atau rekomendasi keuangan, investasi, trading, atau jenis lainnya yang diberikan atau didukung oleh TradingView. Baca selengkapnya di Ketentuan Penggunaan.