PROTECTED SOURCE SCRIPT
RSI , Money Flow Index, Anormal Relative Volume 3in1 indicator
https://www.tradingview.com/x/YKgp5rB8/
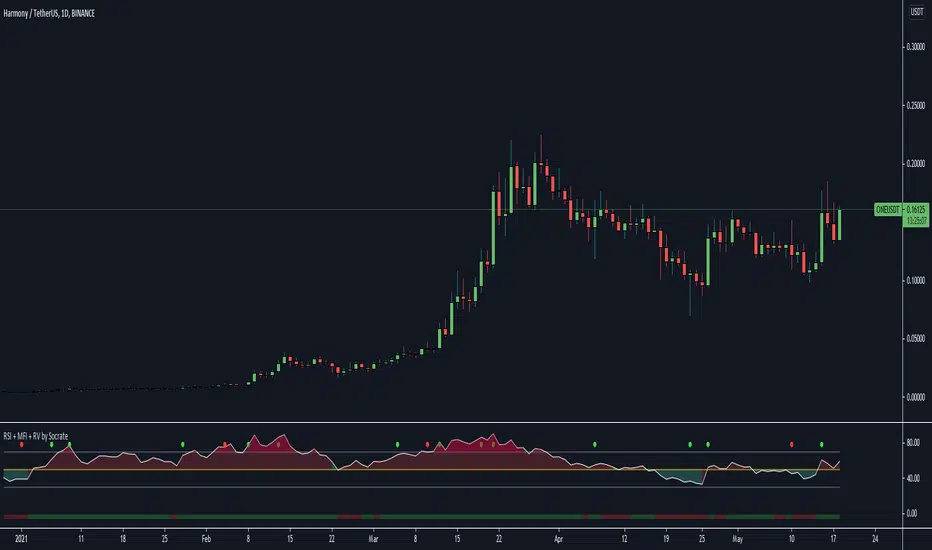
RSI , Money Flow Index and Anormal Relative Volume indicator.
How the indicator works ? You have dot's on the top to show you the anormal relative volumes (you can adjust it with the treshold), you have a classical RSI cloud wich give you an quick opinion about the trend momemtum strengh, and the bar on bottom gives you a quick hint on the actual moneyflow stream.
Inputs that you can setup :
- Source
- RSI Lenght
- Neutral level
- Overbought value
- Oversold value
- MFI Lengh
- RV length
- RV Period
- RV Treshold
- RV smoothing value
- RV Breakout Based on
!!!!!!!!!!!!!!!!!!!!!!!!!!
Remember, an oversold RSI doesn't mean you should BUY an asset, it means the momentum is week on the bull side, the same but opposit for Overbought ;)
!!!!!!!!!!!!!!!!!!!!!!!!!
Relative anormal volumes are a good hint on something is happening on an asset, remember, dont put the treshold too low, i recommended min value on 1.25 for stocks, min value 1.5/1.8 for crypto-currencies.
!!!!!!!!!!!!!!!!!!!!!!!!!
Have fun !
Skrip terproteksi
Skrip ini diterbitkan sebagai sumber tertutup. Namun, Anda dapat menggunakannya dengan bebas dan tanpa batasan apa pun – pelajari lebih lanjut di sini.
Pernyataan Penyangkalan
Informasi dan publikasi ini tidak dimaksudkan, dan bukan merupakan, saran atau rekomendasi keuangan, investasi, trading, atau jenis lainnya yang diberikan atau didukung oleh TradingView. Baca selengkapnya di Ketentuan Penggunaan.