OPEN-SOURCE SCRIPT
SDSpike
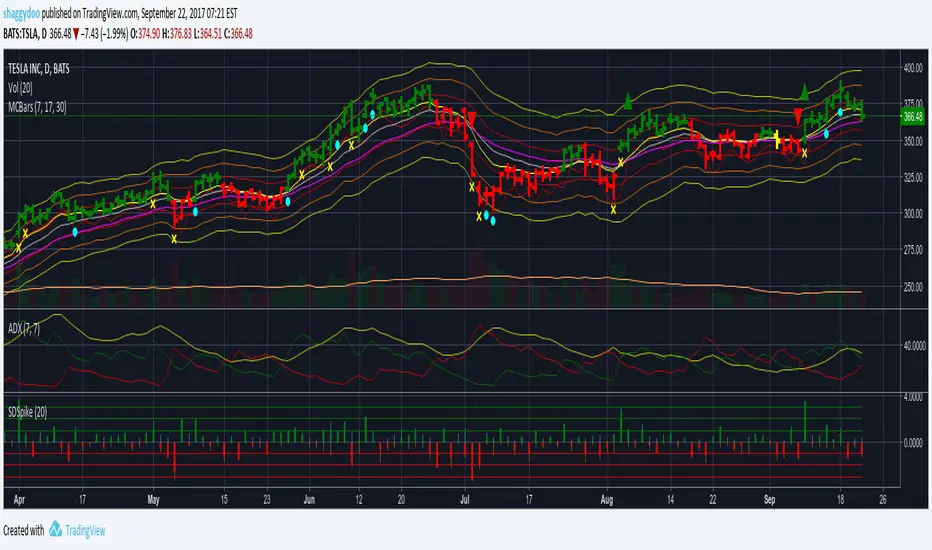
Price Change as Standard Deviation Spikes
Plots price changes scaled to daily StdDev for the period
The Close price change is plotted as a thick bar coloured green for up close, red for down close
The High price change is plotted as a thin bar coloured aqua
The Low price change is plotted as a thin bar coloured orange
Can be used to understand the statistical price behaviour of the symbol.
Very useful for earnings trades and in general for options trades.
Skrip open-source
Dengan semangat TradingView yang sesungguhnya, pembuat skrip ini telah menjadikannya sebagai sumber terbuka, sehingga para trader dapat meninjau dan memverifikasi fungsinya. Salut untuk penulisnya! Meskipun Anda dapat menggunakannya secara gratis, perlu diingat bahwa penerbitan ulang kode ini tunduk pada Tata Tertib kami.
Pernyataan Penyangkalan
Informasi dan publikasi ini tidak dimaksudkan, dan bukan merupakan, saran atau rekomendasi keuangan, investasi, trading, atau jenis lainnya yang diberikan atau didukung oleh TradingView. Baca selengkapnya di Ketentuan Penggunaan.