OPEN-SOURCE SCRIPT
Diupdate SAR Pullback By TradingConToto
Name & Version
SAR Pullback UX Improved (Pine Script v5)
Core Logic
Calculates two EMAs (fast and slow) to identify overall trend direction.
Uses the Parabolic SAR to detect “flip” points (when SAR crosses price), marking micro-trend reversals.
Micro-Trend Extremes
Tracks the highest high after a bullish flip (SAR below price) and the lowest low after a bearish flip (SAR above price).
These extremes feed into the stop-loss approximation.
Approximate Stop-Loss (“SL aprox”)
If SAR is below price (bullish), SL ≔ (micro-trend high − current SAR).
If SAR is above price (bearish), SL ≔ (current SAR − micro-trend low).
Leverage Calculation
User-defined “UR in USD” input.
Computes leverage as UR ÷ SL, giving you an estimate of position sizing potential.
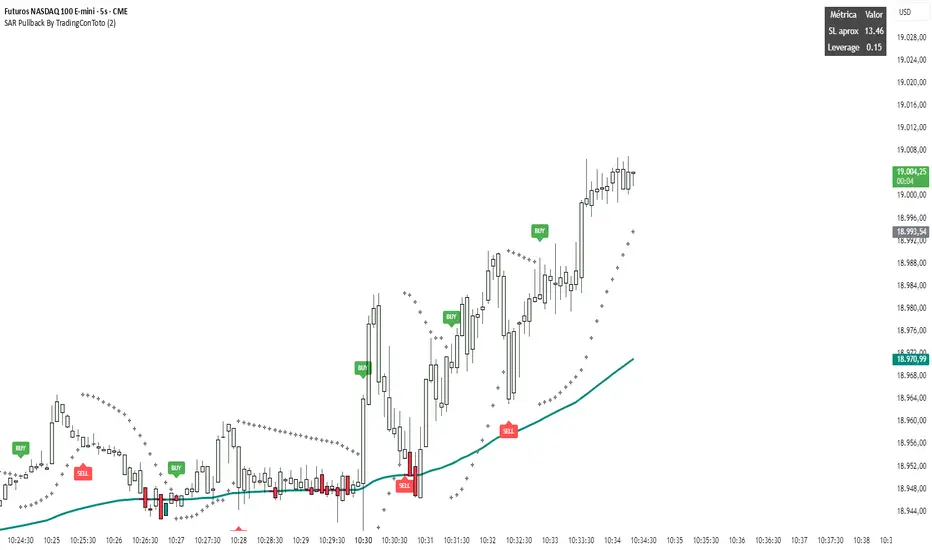
On-Chart Signals
BUY label at each bullish flip, with SL and leverage printed.
SELL label at each bearish flip, likewise showing SL and leverage.
Customizable UI
Inputs to toggle display of SL, leverage, or both.
Choose your UR value, panel background/text colors, and BUY/SELL label colors.
Panel position fixed at top-right by default, showing a 2×3 table:
Header row (“Metric” / “Value”)
“SL aprox” row
“Leverage” row
Visuals
Plots the slow EMA colored by trend.
Draws SAR as crosses.
Bar colors shade green/red according to bullish/bearish conditions.
Semi-transparent, styled panel for quick glance of key metrics.
This indicator combines trend filtering, automated stop-loss sizing, and leverage guidance into a single, fully-configurable Pine Script tool—giving you clear on-chart signals plus a neat metrics panel for streamlined decision-making.
SAR Pullback UX Improved (Pine Script v5)
Core Logic
Calculates two EMAs (fast and slow) to identify overall trend direction.
Uses the Parabolic SAR to detect “flip” points (when SAR crosses price), marking micro-trend reversals.
Micro-Trend Extremes
Tracks the highest high after a bullish flip (SAR below price) and the lowest low after a bearish flip (SAR above price).
These extremes feed into the stop-loss approximation.
Approximate Stop-Loss (“SL aprox”)
If SAR is below price (bullish), SL ≔ (micro-trend high − current SAR).
If SAR is above price (bearish), SL ≔ (current SAR − micro-trend low).
Leverage Calculation
User-defined “UR in USD” input.
Computes leverage as UR ÷ SL, giving you an estimate of position sizing potential.
On-Chart Signals
BUY label at each bullish flip, with SL and leverage printed.
SELL label at each bearish flip, likewise showing SL and leverage.
Customizable UI
Inputs to toggle display of SL, leverage, or both.
Choose your UR value, panel background/text colors, and BUY/SELL label colors.
Panel position fixed at top-right by default, showing a 2×3 table:
Header row (“Metric” / “Value”)
“SL aprox” row
“Leverage” row
Visuals
Plots the slow EMA colored by trend.
Draws SAR as crosses.
Bar colors shade green/red according to bullish/bearish conditions.
Semi-transparent, styled panel for quick glance of key metrics.
This indicator combines trend filtering, automated stop-loss sizing, and leverage guidance into a single, fully-configurable Pine Script tool—giving you clear on-chart signals plus a neat metrics panel for streamlined decision-making.
Catatan Rilis
Update mathsCatatan Rilis
Update bad mathSkrip open-source
Dengan semangat TradingView yang sesungguhnya, pembuat skrip ini telah menjadikannya sebagai sumber terbuka, sehingga para trader dapat meninjau dan memverifikasi fungsinya. Salut untuk penulisnya! Meskipun Anda dapat menggunakannya secara gratis, perlu diingat bahwa penerbitan ulang kode ini tunduk pada Tata Tertib kami.
Pernyataan Penyangkalan
Informasi dan publikasi ini tidak dimaksudkan, dan bukan merupakan, saran atau rekomendasi keuangan, investasi, trading, atau jenis lainnya yang diberikan atau didukung oleh TradingView. Baca selengkapnya di Ketentuan Penggunaan.
Skrip open-source
Dengan semangat TradingView yang sesungguhnya, pembuat skrip ini telah menjadikannya sebagai sumber terbuka, sehingga para trader dapat meninjau dan memverifikasi fungsinya. Salut untuk penulisnya! Meskipun Anda dapat menggunakannya secara gratis, perlu diingat bahwa penerbitan ulang kode ini tunduk pada Tata Tertib kami.
Pernyataan Penyangkalan
Informasi dan publikasi ini tidak dimaksudkan, dan bukan merupakan, saran atau rekomendasi keuangan, investasi, trading, atau jenis lainnya yang diberikan atau didukung oleh TradingView. Baca selengkapnya di Ketentuan Penggunaan.