PROTECTED SOURCE SCRIPT
Diupdate MTF Stochastic Dashboard
What you see:
Settings
Signal mode:
Quick presets
Settings
Signal mode:
Quick presets
Catatan Rilis
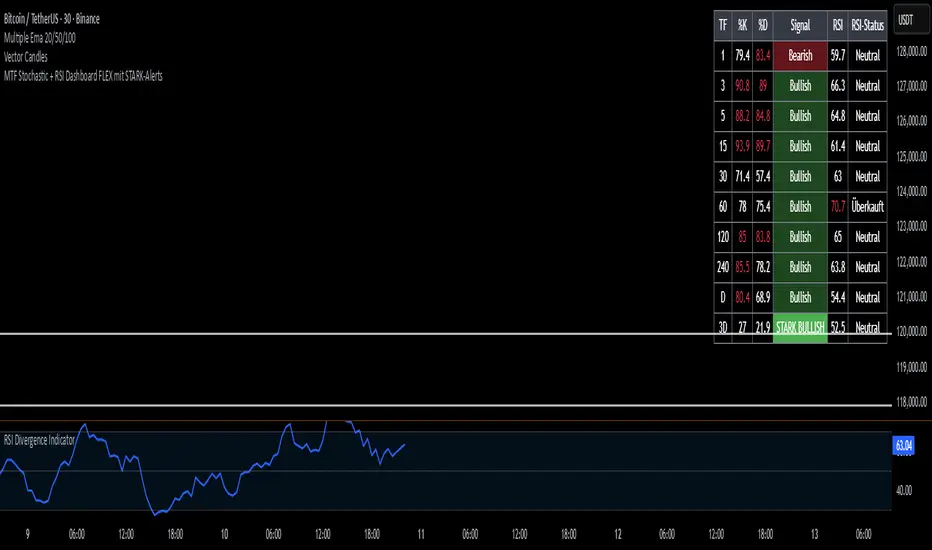
This Pine Script v6 creates a multi-timeframe dashboard that shows Stochastic (%K, %D) and RSI values across 1m–3D.Cells turn red/green when overbought/oversold.
A signal column shows Bullish / Bearish conditions based on gap/cross logic.
An extra column displays the RSI status (Overbought / Oversold / Neutral).
Would you like me to also rename headers and labels to English inside the code so the table matches this description?
Catatan Rilis
This Pine Script is a Multi-Timeframe Stochastic + RSI Dashboard with fully customizable alerts.It shows %K, %D, RSI values, and signal status for multiple timeframes in a table.
Signals are classified as Bullish / Bearish and Strong Bullish / Strong Bearish based on adjustable thresholds.
Colors for signals can be customized in the Style tab.
You can choose which timeframes to display and which ones should trigger alerts.
Alerts only fire on Strong signals, with optional RSI confirmation.
Skrip terproteksi
Skrip ini diterbitkan sebagai sumber tertutup. Namun, Anda dapat menggunakannya dengan bebas dan tanpa batasan apa pun – pelajari lebih lanjut di sini.
Pernyataan Penyangkalan
Informasi dan publikasi ini tidak dimaksudkan, dan bukan merupakan, saran atau rekomendasi keuangan, investasi, trading, atau jenis lainnya yang diberikan atau didukung oleh TradingView. Baca selengkapnya di Ketentuan Penggunaan.