OPEN-SOURCE SCRIPT
Diupdate 29&71 Goldbach levels
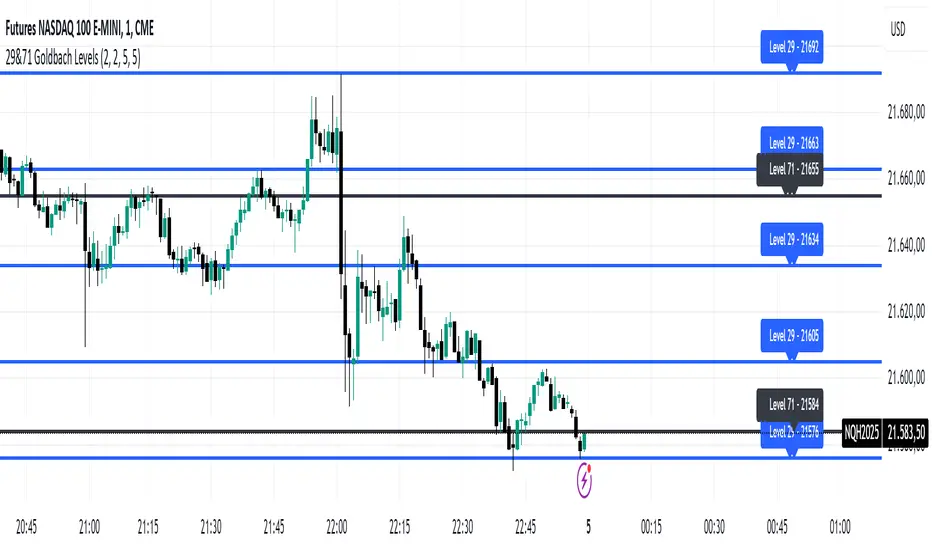
The indicator automatically plots horizontal lines at the 29 and 71 price levels on your chart. These levels serve as psychological barriers in the market, where price action may react or consolidate, just as prime numbers are fundamental in the theory of numbers.
---
Features:
- 29 Level: Identifies significant areas where market participants may encounter support or resistance, similar to the importance of prime numbers in Goldbach's conjecture.
- 71 Level: Marks another key zone that might indicate possible price breakouts or reversals, offering traders a reference point for decision-making.
- Customizable: You can adjust the colors, line styles, or alerts associated with these levels to fit your trading preferences.
How to Use:
- Use the 29 and 71 levels to spot potential areas of support or resistance on the chart.
- Watch for price reactions at these levels for possible breakout or reversal setups.
- Combine the levels with other technical indicators for added confirmation.
---
This indicator blends the theory of prime numbers with market analysis, offering traders a novel approach to identifying key levels that might influence price movements.
---
Features:
- 29 Level: Identifies significant areas where market participants may encounter support or resistance, similar to the importance of prime numbers in Goldbach's conjecture.
- 71 Level: Marks another key zone that might indicate possible price breakouts or reversals, offering traders a reference point for decision-making.
- Customizable: You can adjust the colors, line styles, or alerts associated with these levels to fit your trading preferences.
How to Use:
- Use the 29 and 71 levels to spot potential areas of support or resistance on the chart.
- Watch for price reactions at these levels for possible breakout or reversal setups.
- Combine the levels with other technical indicators for added confirmation.
---
This indicator blends the theory of prime numbers with market analysis, offering traders a novel approach to identifying key levels that might influence price movements.
Catatan Rilis
The indicator automatically plots horizontal lines at the 29 and 71 price levels on your chart. These levels serve as psychological barriers in the market, where price action may react or consolidate, just as prime numbers are fundamental in the theory of numbers.---
Features:
- 29 Level: Identifies significant areas where market participants may encounter support or resistance, similar to the importance of prime numbers in Goldbach's conjecture.
- 71 Level: Marks another key zone that might indicate possible price breakouts or reversals, offering traders a reference point for decision-making.
- Customizable: You can adjust the colors, line styles, or alerts associated with these levels to fit your trading preferences.
How to Use:
- Use the 29 and 71 levels to spot potential areas of support or resistance on the chart.
- Watch for price reactions at these levels for possible breakout or reversal setups.
- Combine the levels with other technical indicators for added confirmation.
---
This indicator blends the theory of prime numbers with market analysis, offering traders a novel approach to identifying key levels that might influence price movements.
Catatan Rilis
New version plotting by default 71 lev midpointsCatatan Rilis
New version with Midpoints for 29 and 71 levelsCatatan Rilis
New version - small bugs solvedSkrip open-source
Dengan semangat TradingView yang sesungguhnya, pembuat skrip ini telah menjadikannya sebagai sumber terbuka, sehingga para trader dapat meninjau dan memverifikasi fungsinya. Salut untuk penulisnya! Meskipun Anda dapat menggunakannya secara gratis, perlu diingat bahwa penerbitan ulang kode ini tunduk pada Tata Tertib kami.
Pernyataan Penyangkalan
Informasi dan publikasi ini tidak dimaksudkan, dan bukan merupakan, saran atau rekomendasi keuangan, investasi, trading, atau jenis lainnya yang diberikan atau didukung oleh TradingView. Baca selengkapnya di Ketentuan Penggunaan.
Skrip open-source
Dengan semangat TradingView yang sesungguhnya, pembuat skrip ini telah menjadikannya sebagai sumber terbuka, sehingga para trader dapat meninjau dan memverifikasi fungsinya. Salut untuk penulisnya! Meskipun Anda dapat menggunakannya secara gratis, perlu diingat bahwa penerbitan ulang kode ini tunduk pada Tata Tertib kami.
Pernyataan Penyangkalan
Informasi dan publikasi ini tidak dimaksudkan, dan bukan merupakan, saran atau rekomendasi keuangan, investasi, trading, atau jenis lainnya yang diberikan atau didukung oleh TradingView. Baca selengkapnya di Ketentuan Penggunaan.