OPEN-SOURCE SCRIPT
Roof and Floors From Actieve Inversiones
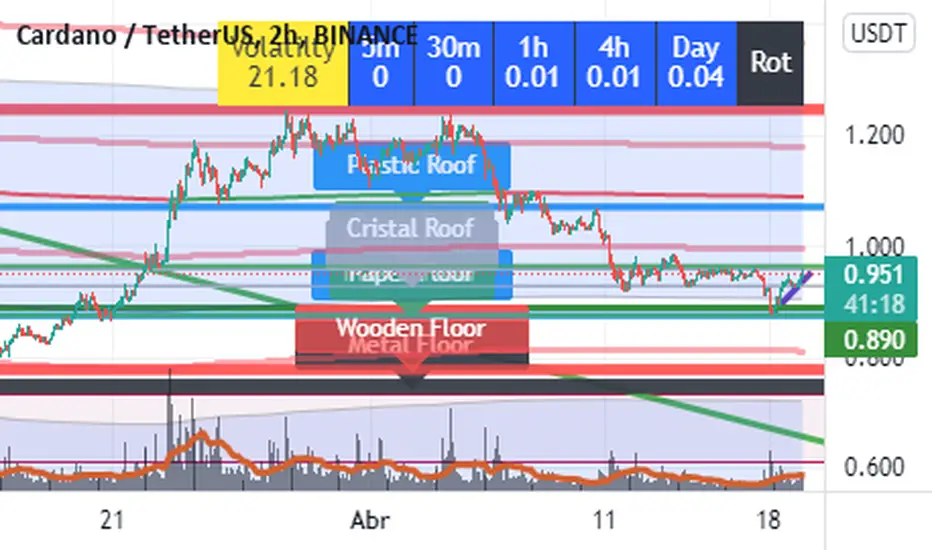
Imagine a Funny and visual way to understand Highest Highs and Lowest Lows. That's the way this indicator was conceived.
The way it Works:
The indicator plots lines in highest highs or lowest lows from a period of "Bars", you only have to set the number of Bars you wanna use and the indicator Makes all the stuff.
This is a Long term Indicator, so it can Show useful Floors or Roofs from higher Timeframes:
Cristal = Five Min Bars
Paper = thirty Min Bars
Plastic = 1 Hour Bars
Wood = 4 hours Bars
Metal = Daily Bars
But wait... There is something better than that...
If The Floor or Roof Brokes, the indicator will plot a dashed line and a label ¨Broken Roof or Floor¨ u can use it to set a Limit Order or Stop Order, and wait for the pullback.
Do you want some useful Advice ? Check the junctions from Floor or Roofs that are overlayed in some level.
Have Fun and good trading!!!
Skrip open-source
Dengan semangat TradingView yang sesungguhnya, pembuat skrip ini telah menjadikannya sebagai sumber terbuka, sehingga para trader dapat meninjau dan memverifikasi fungsinya. Salut untuk penulisnya! Meskipun Anda dapat menggunakannya secara gratis, perlu diingat bahwa penerbitan ulang kode ini tunduk pada Tata Tertib kami.
Pernyataan Penyangkalan
Informasi dan publikasi ini tidak dimaksudkan, dan bukan merupakan, saran atau rekomendasi keuangan, investasi, trading, atau jenis lainnya yang diberikan atau didukung oleh TradingView. Baca selengkapnya di Ketentuan Penggunaan.