OPEN-SOURCE SCRIPT
Diupdate Naked - Daily Weekly Monthly
User request for Naked Daily Weekly Monthly Opens.
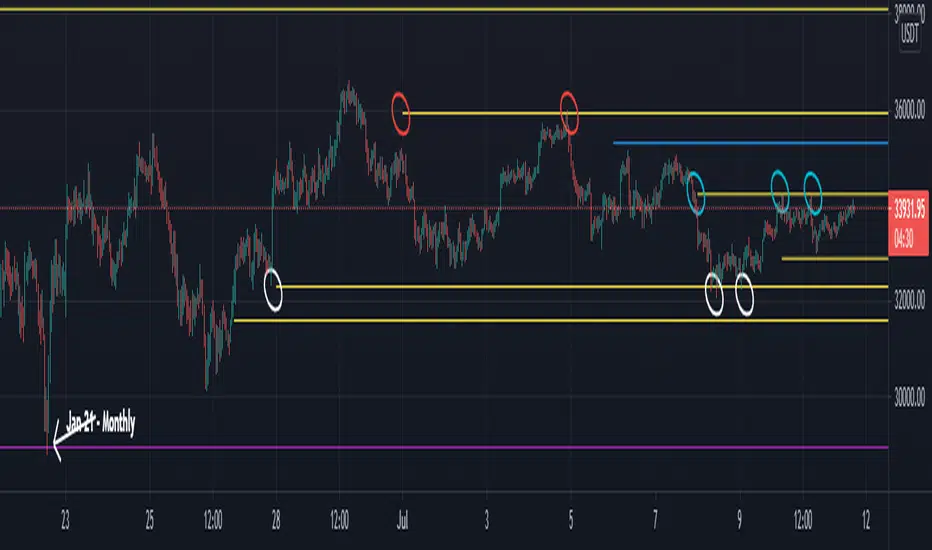
This indicator plots the Daily Weekly Opens (the day after day after creation), they then will stay on the chart until a candle close is completed on the other side of the plot.
In the above chart picture you can see how previous monthly and daily opens have acted as support and resistance.
Thanks go to:
StackOverFlow Bjorn Mistiaen
Catatan Rilis
Disclaimer This indicator works on the daily timeframe and below.
To pick up all naked lines move the chart back in time and then back to current price action.
Catatan Rilis
Update:User request for different line style options.
User can now change the line style from solid to dashed or dotted.
Catatan Rilis
Error highlighted by user in comments. Code updated to resolve issue.
Catatan Rilis
Script update:The script will now show totally Naked and Partially Naked Daily / Weekly / Monthly opens.
When looking back a previous price action keeping the partially Naked Opens as an option looks like a promising level for Technical Analysis.
Totally Naked = No price action breaks the level.
Partially Naked = Either the close or the open candles (Timeframe dependent) has not occurred below or above the level (dependent on Price Action to the level above or below).
Skrip open-source
Dengan semangat TradingView yang sesungguhnya, pembuat skrip ini telah menjadikannya sebagai sumber terbuka, sehingga para trader dapat meninjau dan memverifikasi fungsinya. Salut untuk penulisnya! Meskipun Anda dapat menggunakannya secara gratis, perlu diingat bahwa penerbitan ulang kode ini tunduk pada Tata Tertib kami.
Pernyataan Penyangkalan
Informasi dan publikasi ini tidak dimaksudkan, dan bukan merupakan, saran atau rekomendasi keuangan, investasi, trading, atau jenis lainnya yang diberikan atau didukung oleh TradingView. Baca selengkapnya di Ketentuan Penggunaan.