OPEN-SOURCE SCRIPT
Diupdate DCA Cost Basis (with Lump Sum)
DCA Cost Basis (with Lump Sum) — Pine Script v6
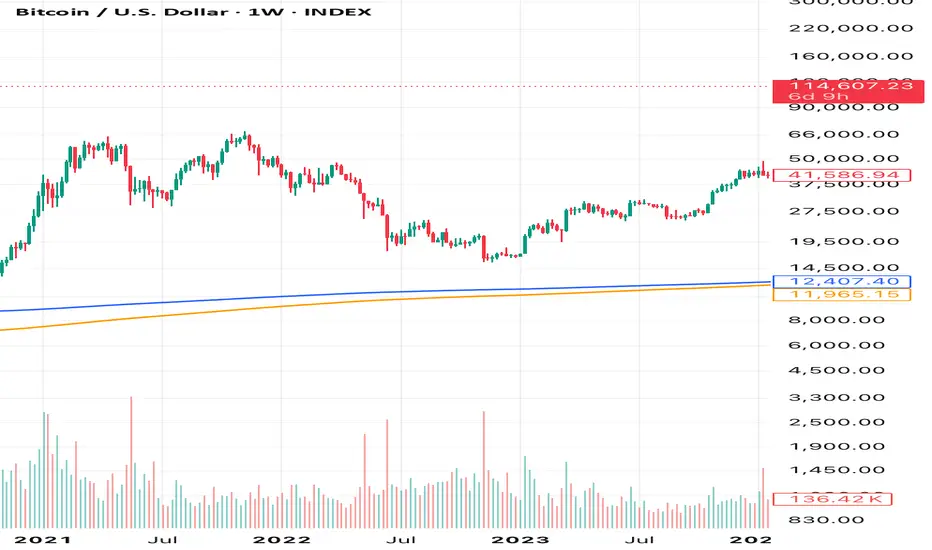
This indicator simulates a Dollar Cost Averaging (DCA) plan directly on your chart. Pick a start date, choose how often to buy (daily/weekly/monthly), set the per-buy amount, optionally add a one-time lump sum on the first date, and visualize your evolving average cost as a VWAP-style line.
[br][br]
Features
[br]
Why use it?
[br]
Note: This tool is for educational/simulation purposes. Results are based on bar closes and do not represent live orders or fees.
This indicator simulates a Dollar Cost Averaging (DCA) plan directly on your chart. Pick a start date, choose how often to buy (daily/weekly/monthly), set the per-buy amount, optionally add a one-time lump sum on the first date, and visualize your evolving average cost as a VWAP-style line.
[br][br]
Features
- Customizable DCA Plan — Set Start Date, buy Frequency (Daily / Weekly / Monthly), and Recurring Amount (in quote currency, e.g., USD).
- Lump Sum Option — Add a one-time lump sum on the very first eligible date; recurring DCA continues automatically after that.
- Cost Basis Line — Plots the live average price (Total Cost / Total Units) as a smooth, VWAP-style line for instant breakeven awareness.
- Buy Markers — Optional triangles below bars to show when simulated buys occur.
- Performance Metrics — Tracks:
Total Invested (quote)
Total Units (base)
Cost Basis (avg entry)
Current Value (mark-to-market)
CAGR (Annualized) from first buy to current bar - On-Chart Summary Table — Displays Start Date, Plan Type (Lump + DCA or DCA only), Total Invested, and CAGR (Annualized).
- Data Window Integration — All key values also appear in the Data Window for deeper inspection.
[br]
Why use it?
- Visualize long-term strategies for Bitcoin, crypto, or stocks.
- See how a lump sum affects your average entry over time.
- Gauge breakeven at a glance and evaluate historical performance.
[br]
Note: This tool is for educational/simulation purposes. Results are based on bar closes and do not represent live orders or fees.
Catatan Rilis
DCA Cost Basis (with Lump Sum) — Pine Script v6Update 15/09/2025: Bug fixes.
This indicator simulates a Dollar Cost Averaging (DCA) plan directly on your chart. Pick a start date, choose how often to buy (daily/weekly/monthly), set the per-buy amount, optionally add a one-time lump sum on the first date, and visualize your evolving average cost as a VWAP-style line.
[br][br]
Features
- Customizable DCA Plan — Set Start Date, buy Frequency (Daily / Weekly / Monthly), and Recurring Amount (in quote currency, e.g., USD).
- Lump Sum Option — Add a one-time lump sum on the very first eligible date; recurring DCA continues automatically after that.
- Cost Basis Line — Plots the live average price (Total Cost / Total Units) as a smooth, VWAP-style line for instant breakeven awareness.
- Buy Markers — Optional triangles below bars to show when simulated buys occur.
- Performance Metrics — Tracks:
Total Invested (quote)
Total Units (base)
Cost Basis (avg entry)
Current Value (mark-to-market)
CAGR (Annualized) from first buy to current bar - On-Chart Summary Table — Displays Start Date, Plan Type (Lump + DCA or DCA only), Total Invested, and CAGR (Annualized).
- Data Window Integration — All key values also appear in the Data Window for deeper inspection.
[br]
Why use it?
- Visualize long-term strategies for Bitcoin, crypto, or stocks.
- See how a lump sum affects your average entry over time.
- Gauge breakeven at a glance and evaluate historical performance.
[br]
Note: This tool is for educational/simulation purposes. Results are based on bar closes and do not represent live orders or fees.
Skrip open-source
Dengan semangat TradingView yang sesungguhnya, pembuat skrip ini telah menjadikannya sebagai sumber terbuka, sehingga para trader dapat meninjau dan memverifikasi fungsinya. Salut untuk penulisnya! Meskipun Anda dapat menggunakannya secara gratis, perlu diingat bahwa penerbitan ulang kode ini tunduk pada Tata Tertib kami.
Pernyataan Penyangkalan
Informasi dan publikasi ini tidak dimaksudkan, dan bukan merupakan, saran atau rekomendasi keuangan, investasi, trading, atau jenis lainnya yang diberikan atau didukung oleh TradingView. Baca selengkapnya di Ketentuan Penggunaan.