(15) Trade Risk Reduction VS-132
Why three? You want a sensitive indicator that reflect both the long term historical volatility of the equity as well as what that volatility is right now. Obviously the most recent trading days are the most important. The three ATR periods and their weighting factors are:
1) We use a 251 day period which equates to 1 trading year because we want to know what the historical volatility is. This one year period is not weighted.
2) We utilize a 21 day period because the most recent weeks tells us what the stock volatility has been over the previous calendar month. This is weighted by a factor of 2.
3) Finally, we utilize the last weeks data, Last 5 days, (L5D) to provide us with the stocks movement in the most recent trading days. This is weighted by a factor of 4.
The total of ATR251*(1) + ATR21*(2) + ATR5*(4) is then divided by the total of all factors (7).
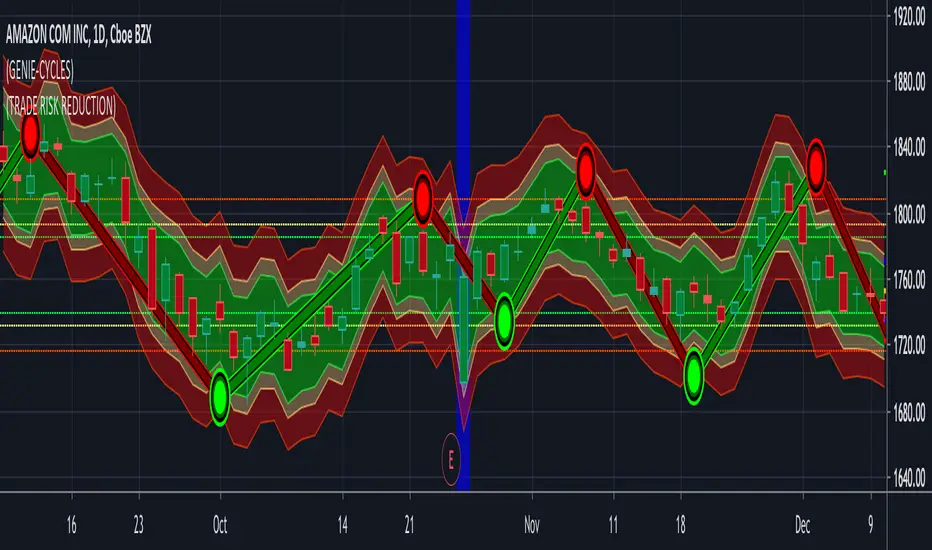
This results in the Weighted Average True Range that the Trade Risk Reduction utilizes to produce the dynamic bands on your charts as well as power the Risk and Stop loss calculators. These indicate where this indicator is currently recommending you place stops. In the Format options of the application you are provided with the ability to adjust these band. Keep in mind that each stock will act in it's own unique and characteristic way. Looking closely at the stock's historical data, both in longer and shorter time periods should provide you with some insight into the normal variations and fluctuations of this particular equity. Below EBAY provides an example of this.
Access this Genie indicator for your Tradingview account, through our web site. (Links Below) This will provide you with additional educational information and reference articles, videos, input and setting options and trading strategies this indicator excels in.
Skrip hanya-undangan
Hanya pengguna yang disetujui oleh penulis yang dapat mengakses skrip ini. Anda perlu meminta dan mendapatkan izin untuk menggunakannya. Izin ini biasanya diberikan setelah pembayaran. Untuk detail selengkapnya, ikuti petunjuk penulis di bawah ini atau hubungi StockSwinger secara langsung.
TradingView TIDAK menyarankan untuk membayar atau menggunakan skrip kecuali Anda sepenuhnya mempercayai pembuatnya dan memahami cara kerjanya. Anda juga dapat menemukan alternatif yang gratis dan sumber terbuka di skrip komunitas kami.
Instruksi penulis
Pernyataan Penyangkalan
Skrip hanya-undangan
Hanya pengguna yang disetujui oleh penulis yang dapat mengakses skrip ini. Anda perlu meminta dan mendapatkan izin untuk menggunakannya. Izin ini biasanya diberikan setelah pembayaran. Untuk detail selengkapnya, ikuti petunjuk penulis di bawah ini atau hubungi StockSwinger secara langsung.
TradingView TIDAK menyarankan untuk membayar atau menggunakan skrip kecuali Anda sepenuhnya mempercayai pembuatnya dan memahami cara kerjanya. Anda juga dapat menemukan alternatif yang gratis dan sumber terbuka di skrip komunitas kami.