Wave Master Pro
Here's a few things you'll want to watch out for when using this indicator:
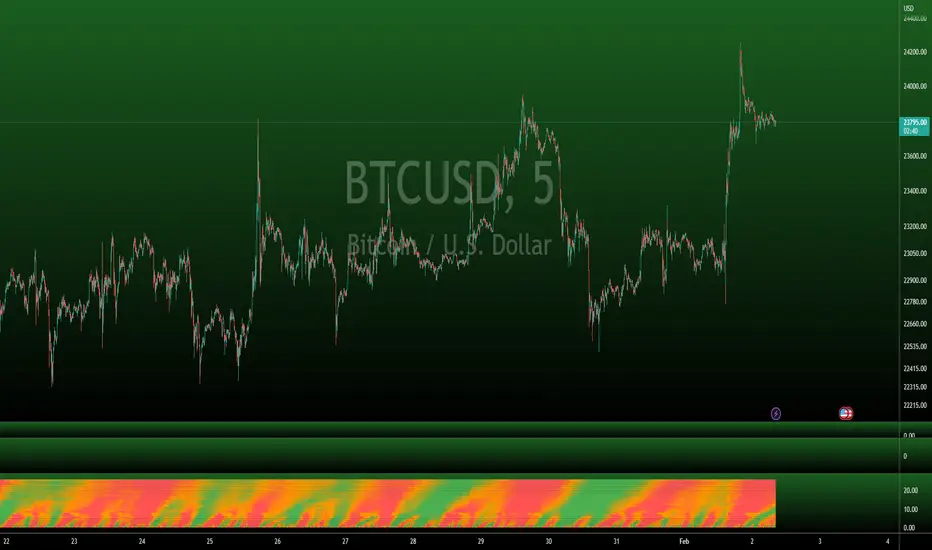
OVERBOUGHT
When a wave goes into overbought or is approaching overbought, you'll notice the heatmap transitioning from orange to red. Probably wise to move up stop losses or close the position out, especially when the entire vertical time slot is completely red.
OVERSOLD
Opposite of overbought, when a wave goes into oversold, the heatmap will transition from orange to green. This could be a good place to close out short positions or be on the lookout for long positions. Again, especially when the entire vertical time slot is completely green.
TIMEFRAMES
This indicator is dynamic in that it will automatically adjust the heatmap timefrmaes as you change the timeframe of your chart.
LIMITATIONS
Due to there being so many different timeframes that are utilized in this indicator, you will find that this indicator works best on 1H timeframes or lower, but it will work up to 4H timeframes. Currently, anything above 4H is not optimal for this indicator. I would recommend using the regular Wave Master indicator if you like using high timeframes.
OTHER USEFUL INFORMATION
This is a vidual aid in determining when many timeframes approach and reach extended levels based on the configuration of the Stochastics that we have found to be most optimal, especially in lower timeframes. It is wise to refer back to the Wave Master indicator for a raw view of the waves.
Skrip hanya-undangan
Hanya pengguna yang disetujui oleh penulis yang dapat mengakses skrip ini. Anda perlu meminta dan mendapatkan izin untuk menggunakannya. Izin ini biasanya diberikan setelah pembayaran. Untuk detail selengkapnya, ikuti petunjuk penulis di bawah ini atau hubungi bitdoctor secara langsung.
TradingView TIDAK menyarankan untuk membayar atau menggunakan skrip kecuali Anda sepenuhnya mempercayai pembuatnya dan memahami cara kerjanya. Anda juga dapat menemukan alternatif yang gratis dan sumber terbuka di skrip komunitas kami.
Instruksi penulis
Access our private indicators and join our Premium Room: bitdoctor.org
Beware of scams - I'll never DM you asking for funds.
Pernyataan Penyangkalan
Skrip hanya-undangan
Hanya pengguna yang disetujui oleh penulis yang dapat mengakses skrip ini. Anda perlu meminta dan mendapatkan izin untuk menggunakannya. Izin ini biasanya diberikan setelah pembayaran. Untuk detail selengkapnya, ikuti petunjuk penulis di bawah ini atau hubungi bitdoctor secara langsung.
TradingView TIDAK menyarankan untuk membayar atau menggunakan skrip kecuali Anda sepenuhnya mempercayai pembuatnya dan memahami cara kerjanya. Anda juga dapat menemukan alternatif yang gratis dan sumber terbuka di skrip komunitas kami.
Instruksi penulis
Access our private indicators and join our Premium Room: bitdoctor.org
Beware of scams - I'll never DM you asking for funds.