OPEN-SOURCE SCRIPT
Diupdate Composite RSI
One issue with the famouse RSI indicator is that it is too sensitive in some cases and thus, might give false signals if we are eager to use those signals.
If we increase the length of the RSI, it might give too few signals which is not ideal as well.
This Composite RSI indicator was created to utilize the RSI strength, using 3 RSIs (with different length) in combination to give less signal than the original one.
You can use it like a normal RSI indicator:
- Try to find the entry when the RSI is in the overbought (RSI >= 70) and oversold (RSI <= 30) areas
- Use bullish divergence and bearish divergence on the RSI itself to signal your trade
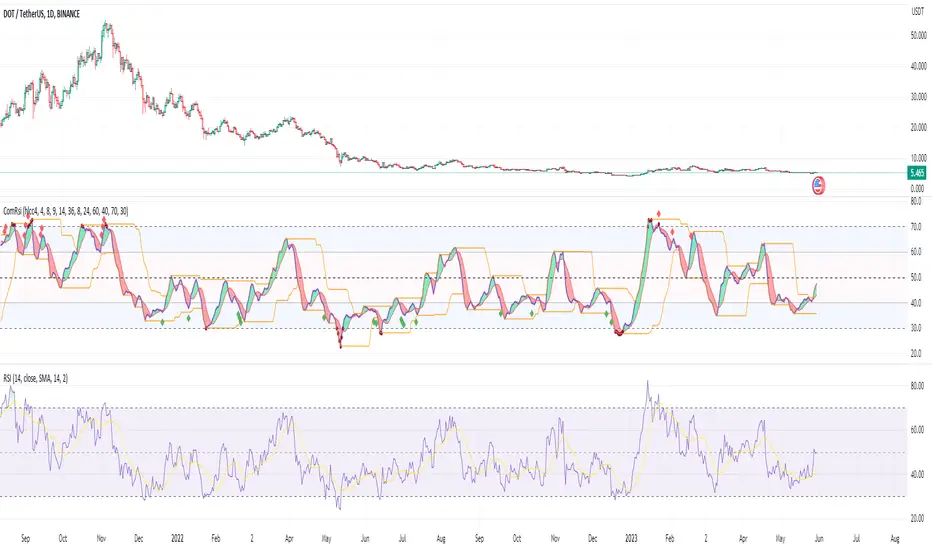
In the example chart, I included a built-in RSI as well so you that you can compare the original one and the Composite RSI indicator.
Some extra features:
- Simple bullish and bearish divergences detection.
- Mark the RSI with green circle(s) when it is extremely overbought (over 80) and oversold (under 20)
If we increase the length of the RSI, it might give too few signals which is not ideal as well.
This Composite RSI indicator was created to utilize the RSI strength, using 3 RSIs (with different length) in combination to give less signal than the original one.
You can use it like a normal RSI indicator:
- Try to find the entry when the RSI is in the overbought (RSI >= 70) and oversold (RSI <= 30) areas
- Use bullish divergence and bearish divergence on the RSI itself to signal your trade
In the example chart, I included a built-in RSI as well so you that you can compare the original one and the Composite RSI indicator.
Some extra features:
- Simple bullish and bearish divergences detection.
- Mark the RSI with green circle(s) when it is extremely overbought (over 80) and oversold (under 20)
Catatan Rilis
Update chart.Skrip open-source
Dengan semangat TradingView yang sesungguhnya, pembuat skrip ini telah menjadikannya sebagai sumber terbuka, sehingga para trader dapat meninjau dan memverifikasi fungsinya. Salut untuk penulisnya! Meskipun Anda dapat menggunakannya secara gratis, perlu diingat bahwa penerbitan ulang kode ini tunduk pada Tata Tertib kami.
Pernyataan Penyangkalan
Informasi dan publikasi ini tidak dimaksudkan, dan bukan merupakan, saran atau rekomendasi keuangan, investasi, trading, atau jenis lainnya yang diberikan atau didukung oleh TradingView. Baca selengkapnya di Ketentuan Penggunaan.
Skrip open-source
Dengan semangat TradingView yang sesungguhnya, pembuat skrip ini telah menjadikannya sebagai sumber terbuka, sehingga para trader dapat meninjau dan memverifikasi fungsinya. Salut untuk penulisnya! Meskipun Anda dapat menggunakannya secara gratis, perlu diingat bahwa penerbitan ulang kode ini tunduk pada Tata Tertib kami.
Pernyataan Penyangkalan
Informasi dan publikasi ini tidak dimaksudkan, dan bukan merupakan, saran atau rekomendasi keuangan, investasi, trading, atau jenis lainnya yang diberikan atau didukung oleh TradingView. Baca selengkapnya di Ketentuan Penggunaan.