OPEN-SOURCE SCRIPT
Diupdate EMA 200 Price Deviation Alerts (1H Only)
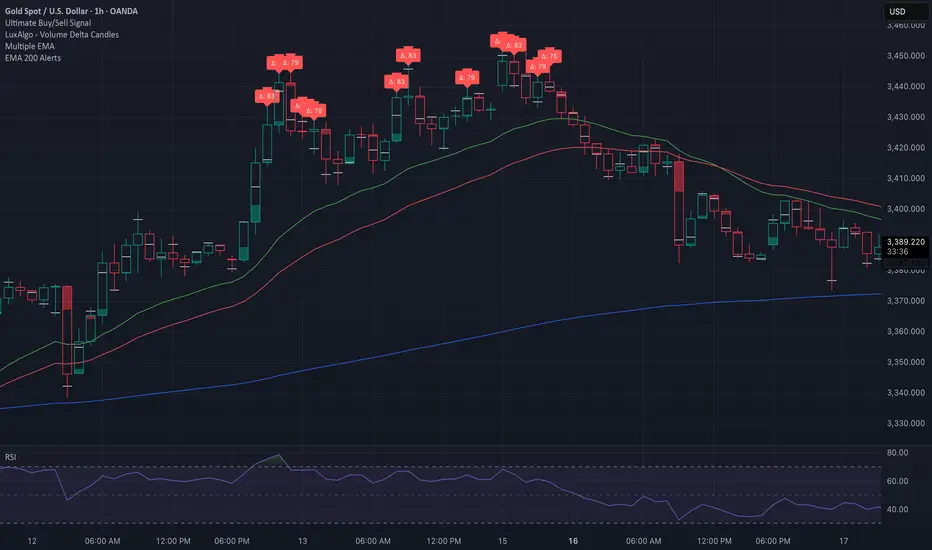
This script monitors the price deviation from the 200-period Exponential Moving Average (EMA) exclusively on the 1-hour chart. It generates alerts when the absolute difference between the current price and the EMA 200 exceeds a user-defined threshold (default: 65).
Features:
Works only on 1-hour (60-minute) charts to avoid false signals on other timeframes.
Customizable deviation threshold via script input.
Visual display of the 200 EMA on the chart.
Alert system to notify when price deviates significantly above or below the EMA.
Buy/Sell arrows shown when conditions are met:
Sell arrow appears when price is above the EMA and deviation exceeds threshold.
Buy arrow appears when price is below the EMA and deviation exceeds threshold.
Use this tool to identify potential overextended price moves relative to long-term trend support or resistance on the 1H timeframe.
Catatan Rilis
updated shows difference on 1 HR chart
Catatan Rilis
updated bars to show deviation on 1 hr chartCatatan Rilis
updated option to select deselect buy/sell signal labelSkrip open-source
Dengan semangat TradingView yang sesungguhnya, penulis skrip ini telah menjadikannya sumber terbuka, sehingga para trader dapat meninjau dan memverifikasi fungsinya. Hormat untuk penulisnya! Meskipun anda dapat menggunakannya secara gratis, ingatlah bahwa penerbitan ulang kode tersebut tunduk pada Tata Tertib kami.
Pernyataan Penyangkalan
Informasi dan publikasi tidak dimaksudkan untuk menjadi, dan bukan merupakan saran keuangan, investasi, perdagangan, atau rekomendasi lainnya yang diberikan atau didukung oleh TradingView. Baca selengkapnya di Persyaratan Penggunaan.
Skrip open-source
Dengan semangat TradingView yang sesungguhnya, penulis skrip ini telah menjadikannya sumber terbuka, sehingga para trader dapat meninjau dan memverifikasi fungsinya. Hormat untuk penulisnya! Meskipun anda dapat menggunakannya secara gratis, ingatlah bahwa penerbitan ulang kode tersebut tunduk pada Tata Tertib kami.
Pernyataan Penyangkalan
Informasi dan publikasi tidak dimaksudkan untuk menjadi, dan bukan merupakan saran keuangan, investasi, perdagangan, atau rekomendasi lainnya yang diberikan atau didukung oleh TradingView. Baca selengkapnya di Persyaratan Penggunaan.