OPEN-SOURCE SCRIPT
Diupdate Sessions on Chart
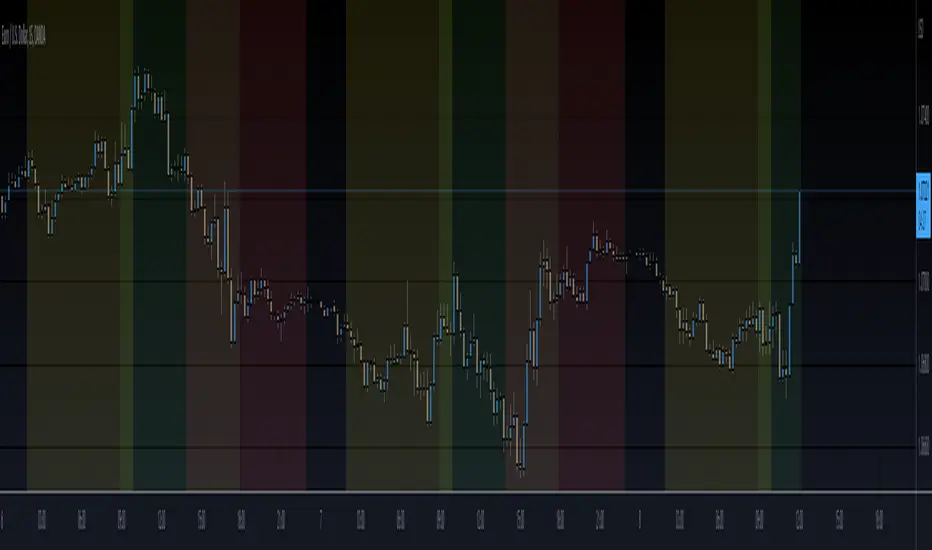
This script shows the London and NY Sessions on your chart. Decided to publish it on demand for user yuan642 :D. Maybe other users may find it helpful.
Looking back on charts it can help to spot certain moves or patterns around certain Session open when high volumes enter the markets.
Looking back on charts it can help to spot certain moves or patterns around certain Session open when high volumes enter the markets.
Catatan Rilis
The script has been updated with the following features:- Tokyo Session
- the background is colored for each session between highs and lows of timeframe chosen (D, W, M).
Examples of this indicator calculated with highs and lows for each session on daily, weekly and monthly basis, respectively:
https://www.tradingview.com/x/Spo0RHf1/
https://www.tradingview.com/x/cY1IHCdd/
https://www.tradingview.com/x/rcEMwBWN/
View only of the sessions with highs and lows calculated on daily timeframe:
https://www.tradingview.com/x/dzDCE3Hd/
Hope you enjoy the update!
Catatan Rilis
The script has been updated with the following features:- Tokyo Session
- the background is colored for each session between highs and lows of timeframe chosen (D, W, M).
Catatan Rilis
- After getting messages from users that they prefer the previous background view, I have changed to the previous view by default with Asia Session extra. - The new features with highs and lows can be activated in the settings.
Catatan Rilis
- After getting messages from users that they prefer the previous background view, I have changed to the previous view by default with Asia Session extra. - The new features with highs and lows can be activated in the settings.
Catatan Rilis
- Manage the plotted sessions by ticking in the settings.
- Sydney session added as well.
Catatan Rilis
- Manage the plotted sessions by ticking in the settings.
- Aussie session added as well.
Catatan Rilis
Fixed minor mistakes.Catatan Rilis
Corrected minor mistakesCatatan Rilis
Fixes the blue boxes issues.Catatan Rilis
Changed the script back to how it was before the pine process issues.Catatan Rilis
The change in behavior on weekends due to the new version upgrade has been mitigated.Catatan Rilis
In the High/Low View, each session does not start with the previous session's range anymore. The new update eliminates the "spikes" from the chart.Catatan Rilis
- Updated the script to the Pine Script v5 version- Solved the issue of Timezone Differences
Skrip open-source
Dengan semangat TradingView yang sesungguhnya, pembuat skrip ini telah menjadikannya sebagai sumber terbuka, sehingga para trader dapat meninjau dan memverifikasi fungsinya. Salut untuk penulisnya! Meskipun Anda dapat menggunakannya secara gratis, perlu diingat bahwa penerbitan ulang kode ini tunduk pada Tata Tertib kami.
Pernyataan Penyangkalan
Informasi dan publikasi ini tidak dimaksudkan, dan bukan merupakan, saran atau rekomendasi keuangan, investasi, trading, atau jenis lainnya yang diberikan atau didukung oleh TradingView. Baca selengkapnya di Ketentuan Penggunaan.