OPEN-SOURCE SCRIPT
Slope
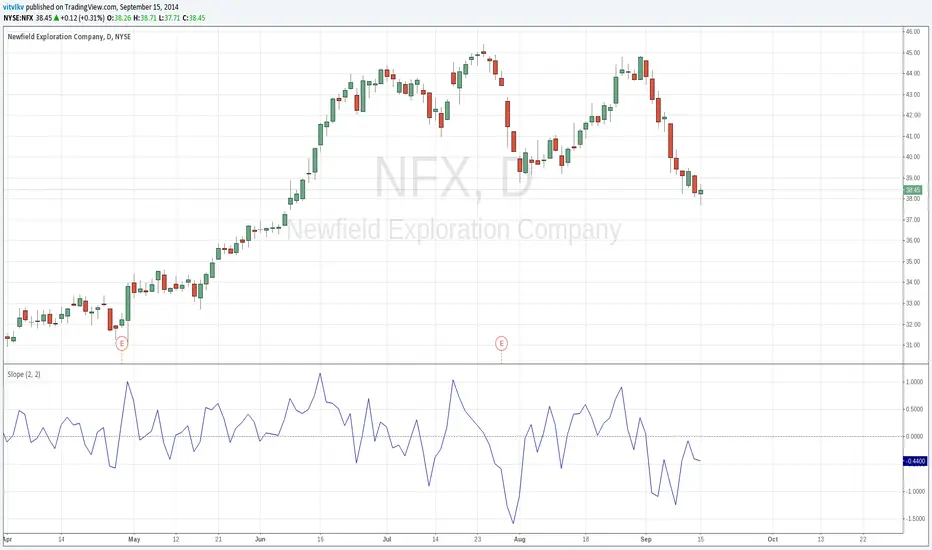
The slope indicator measures the rise-over-run of a linear regression, which is the line of best fit for a price series. Fluctuating above and below zero, the Slope indicator best resembles a momentum oscillator without boundaries. It is not well suited for overbought/oversold levels, but can measure the direction and strength of a trend. It can also be used with other indicators do identify potential entry points within an ongoing trend. (stockcharts.com/school/doku.php?id=chart_school:technical_indicators:slope)
Skrip open-source
Dengan semangat TradingView yang sesungguhnya, pembuat skrip ini telah menjadikannya sebagai sumber terbuka, sehingga para trader dapat meninjau dan memverifikasi fungsinya. Salut untuk penulisnya! Meskipun Anda dapat menggunakannya secara gratis, perlu diingat bahwa penerbitan ulang kode ini tunduk pada Tata Tertib kami.
Pernyataan Penyangkalan
Informasi dan publikasi ini tidak dimaksudkan, dan bukan merupakan, saran atau rekomendasi keuangan, investasi, trading, atau jenis lainnya yang diberikan atau didukung oleh TradingView. Baca selengkapnya di Ketentuan Penggunaan.