OPEN-SOURCE SCRIPT
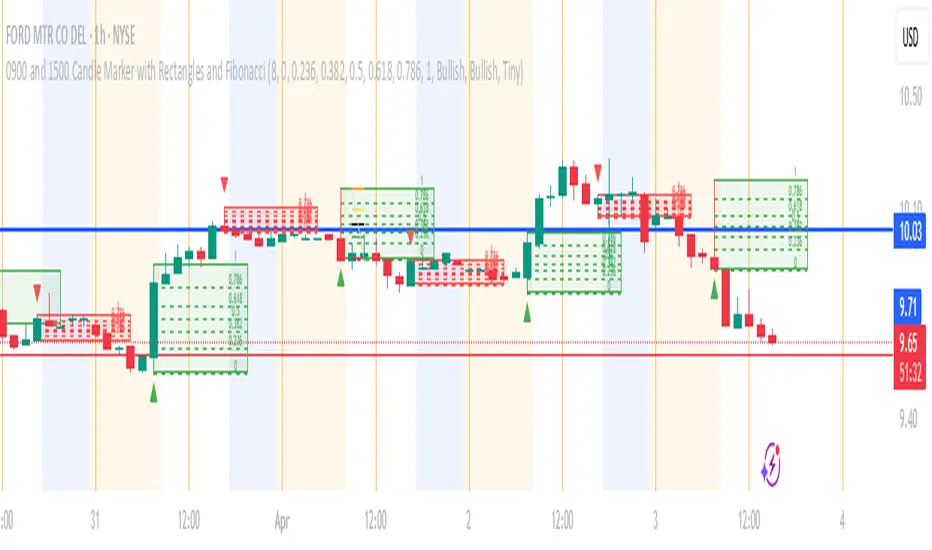
0900 and 1500 Candle Marker with Rectangles and Fibonacci
Welcome to the Indicator
// This tool is designed to help you analyze stock - crypto - or futures charts on TradingView by marking specific times - 9:00 AM and 3:00 PM (Eastern Time) - with colored rectangles and optional Fibonacci levels.
// It is perfect for spotting key moments in your trading day - like market opens or afternoon shifts - and understanding price ranges with simple lines and numbers.
// Whether you are new to trading or just want an easy way to visualize these times - this indicator is here to assist you.
//
// What It Does
// - Draws a green rectangle at 9:00 AM and a red rectangle at 3:00 PM on your chart - based on Eastern Time (America/New_York timezone).
// - Adds dashed lines inside these rectangles (called Fibonacci levels) to show important price points - like 0.236 or 0.618 of the rectangle’s height.
// - Places numbers on these lines (e.g. "0.5") so you can see exactly what each level represents.
// - Works on different chart types (stocks - crypto - futures) and adjusts for futures trading hours if needed.
// - Is designed to work best on timeframes of 1 hour or shorter (like 1-hour - 30-minute - 15-minute - 5-minute - or 1-minute charts) - where you can see the 9:00 AM and 3:00 PM candles clearly.
// - Lets you customize what you see through a settings menu - like hiding some lines or changing colors.
YOU MAY NOT MONETIZE
ANY PORTION OF THIS CODE.
WE ARE ALL IN THIS THING TOGETHER TO WIN.
BE A BLESSING ONTO THE WORLD AND GIVE.:)
Skrip open-source
Dengan semangat TradingView yang sesungguhnya, pembuat skrip ini telah menjadikannya sebagai sumber terbuka, sehingga para trader dapat meninjau dan memverifikasi fungsinya. Salut untuk penulisnya! Meskipun Anda dapat menggunakannya secara gratis, perlu diingat bahwa penerbitan ulang kode ini tunduk pada Tata Tertib kami.
Pernyataan Penyangkalan
Informasi dan publikasi ini tidak dimaksudkan, dan bukan merupakan, saran atau rekomendasi keuangan, investasi, trading, atau jenis lainnya yang diberikan atau didukung oleh TradingView. Baca selengkapnya di Ketentuan Penggunaan.