OPEN-SOURCE SCRIPT
Elder Force Index Oscillator @shrilss
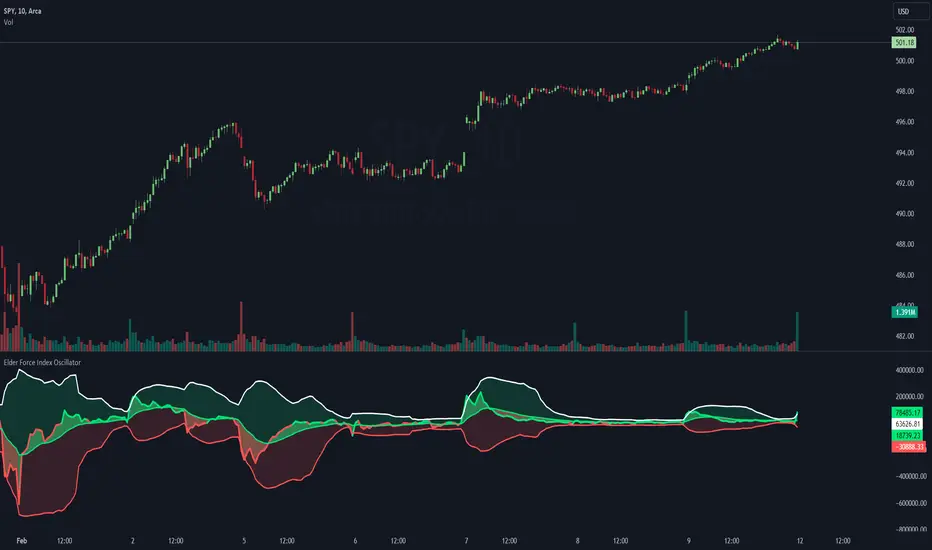
The "Elder Force Index Oscillator" is a comprehensive tool designed to assess the strength and direction of trends in the market. This indicator combines volume and price movement to provide traders with valuable insights into market dynamics.
Key Features:
- Volume Weighted: The oscillator considers both price changes and volume, emphasizing the significance of volume in confirming price movements.
- Trend Identification: Utilizing exponential moving averages (EMAs) and Bollinger Bands (BB), the indicator identifies potential trend reversals and continuations.
- Trend Strength Highlighting: With customizable options, the script highlights areas of strong and weak trend initiation, aiding traders in making informed decisions.
How It Works:
- Elder Force Index (EFI): The EFI is calculated as the EMA of price changes multiplied by volume. A positive value suggests buying pressure, while a negative value indicates selling pressure.
- EFI Moving Average (EFI MA): This smooths out the EFI, providing a clearer indication of trend direction.
- Bollinger Bands (BB): The upper and lower bands are calculated based on a specified number of standard deviations from the EFI's moving average, offering insights into potential overbought or oversold conditions.
Skrip open-source
Dengan semangat TradingView yang sesungguhnya, pembuat skrip ini telah menjadikannya sebagai sumber terbuka, sehingga para trader dapat meninjau dan memverifikasi fungsinya. Salut untuk penulisnya! Meskipun Anda dapat menggunakannya secara gratis, perlu diingat bahwa penerbitan ulang kode ini tunduk pada Tata Tertib kami.
Pernyataan Penyangkalan
Informasi dan publikasi ini tidak dimaksudkan, dan bukan merupakan, saran atau rekomendasi keuangan, investasi, trading, atau jenis lainnya yang diberikan atau didukung oleh TradingView. Baca selengkapnya di Ketentuan Penggunaan.