OPEN-SOURCE SCRIPT
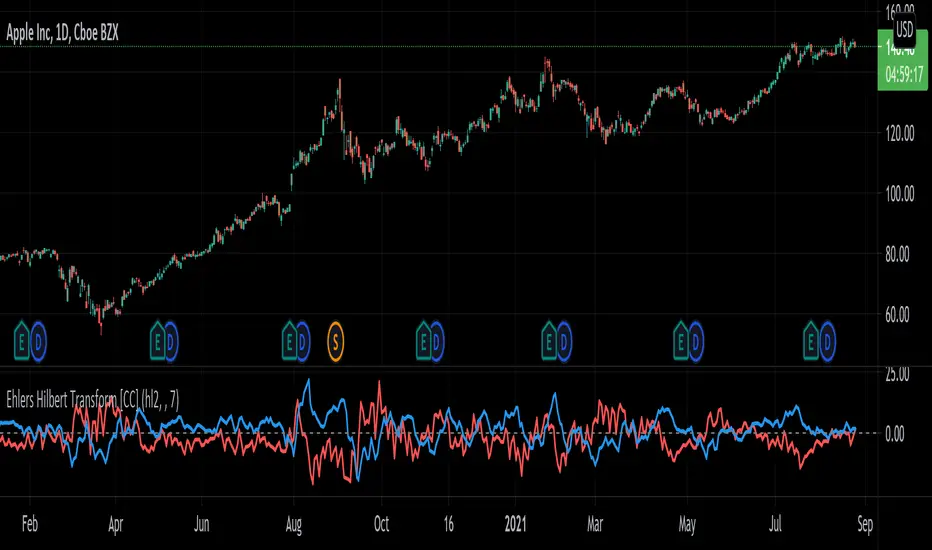
Ehlers Hilbert Transform [CC]

The Hilbert Transform was created by John Ehlers (Stocks & Commodities V. 18:3 (16-27)) and this indicator can work pretty well as a trend confirmation. This essentially transforms the underlying price data into a soundwave and when you compare the two (blue is positive and red is negative) then it provides fairly clear buy and sell signals. Ehlers did warn in his original article that this indicator has a lag of 4 bars so you have to keep that in mind. I have found that this indicator works pretty well when you buy when the blue line goes over the red line and sell when the blue lines hits the zero line. You could also ignore the red line and buy when the blue line crosses over the zero line and sell when it crosses under. Let me know how you wind up using this indicator in your trading.
Let me know if there are any other scripts you would like to see me publish!
Let me know if there are any other scripts you would like to see me publish!
Skrip open-source
Dengan semangat TradingView yang sesungguhnya, pembuat skrip ini telah menjadikannya sebagai sumber terbuka, sehingga para trader dapat meninjau dan memverifikasi fungsinya. Salut untuk penulisnya! Meskipun Anda dapat menggunakannya secara gratis, perlu diingat bahwa penerbitan ulang kode ini tunduk pada Tata Tertib kami.
Pernyataan Penyangkalan
Informasi dan publikasi ini tidak dimaksudkan, dan bukan merupakan, saran atau rekomendasi keuangan, investasi, trading, atau jenis lainnya yang diberikan atau didukung oleh TradingView. Baca selengkapnya di Ketentuan Penggunaan.