PROTECTED SOURCE SCRIPT
RSI -> PROFABIGHI_CAPITAL
🌟 Overview
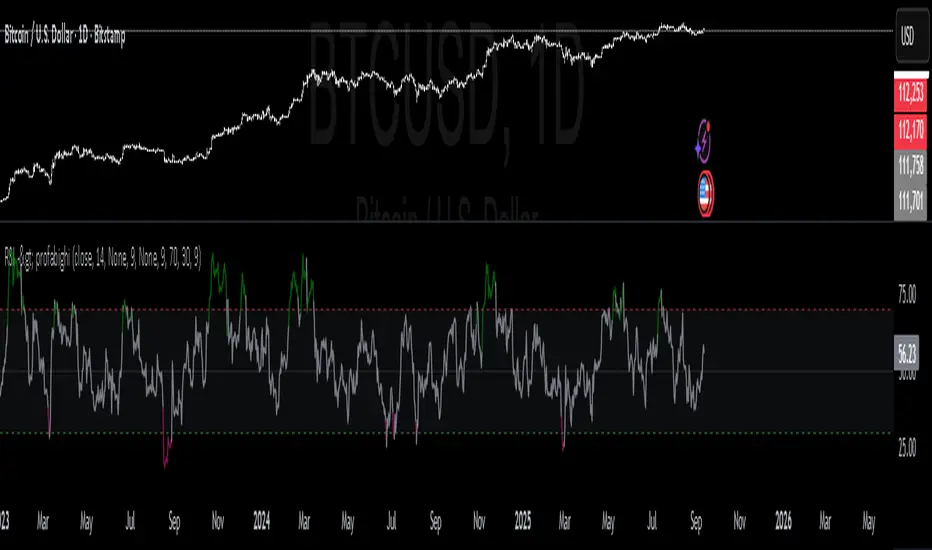
This RSI → PROFABIGHI_CAPITAL implements an advanced Relative Strength Index with sophisticated dual-layer smoothing capabilities and enhanced visualization for superior momentum analysis and overbought/oversold identification.
It provides Multi-method smoothing system supporting nine different moving average types for RSI refinement, Dual-smoothing architecture enabling comparison between two independently configured smoothed RSI lines, VIDYA volatility-adaptive smoothing for dynamic market condition responsiveness, and Enhanced visual framework with color-coded signals and customizable extreme level zones for comprehensive momentum oscillator analysis.
🔧 Advanced RSI Configuration Framework
- Professional RSI implementation with customizable price source selection and adjustable calculation periods for different market sensitivities
- RSI Source Selection enabling close, high, low, or other price inputs for flexible momentum calculation adaptation
- RSI Length Configuration providing adjustable calculation periods balancing responsiveness versus smoothness for different trading styles
- Extreme Level Management offering configurable overbought and oversold thresholds for personalized signal generation
- VIDYA Volatility Integration using Variable Index Dynamic Average with configurable volatility lookback for adaptive smoothing
- Precision Controls supporting price formatting and decimal precision for accurate momentum measurement display
📊 Multi-Method Smoothing Engine
- Nine Smoothing Options supporting SMA, EMA, WMA, HMA, RMA, LSMA, DEMA, TEMA, and VIDYA methods for comprehensive RSI refinement
- First Layer Smoothing providing primary RSI smoothing with configurable method selection and period adjustment for noise reduction
- Second Layer Smoothing enabling additional smoothing layer with independent method and period configuration for enhanced signal clarity
- Advanced Moving Averages implementing DEMA and TEMA calculations for reduced lag and improved responsiveness
- Hull Moving Average Integration offering HMA smoothing for optimal balance between smoothness and responsiveness
- Linear Regression Smoothing providing LSMA option for trend-following RSI interpretation with mathematical precision
- VIDYA Implementation using volatility-adjusted smoothing that adapts to market conditions automatically
🔄 Dual-Smoothing Comparison System
- Independent Smoothing Layers allowing separate configuration of two different smoothing methods and periods for RSI comparison
- Comparison Mode Activation enabling dual-line display with crossover analysis for enhanced signal generation
- Color-Coded Relationship using green coloring when first smoothed RSI is below second smoothed RSI and red when above
- Crossover Signal Generation providing visual cues for momentum shifts through smoothed RSI line intersections
- Flexible Configuration supporting any combination of smoothing methods for customized momentum analysis
- Signal Validation Framework using dual-smoothing agreement for higher-confidence momentum signals
📈 VIDYA Volatility-Adaptive Implementation
- Volatility Measurement System calculating standard deviation of RSI values over configurable lookback periods for market condition assessment
- Adaptive Smoothing Factor automatically adjusting smoothing intensity based on current market volatility levels
- Alpha Coefficient Calculation using mathematical formulation for optimal smoothing factor determination
- K-Factor Integration implementing volatility ratio for dynamic smoothing adjustment with boundary constraints
- Mathematical Precision ensuring proper VIDYA calculation through error handling and edge case management
- Market Condition Responsiveness providing more smoothing during calm markets and less during volatile periods
🎨 Enhanced Visual Framework
- Dynamic Color Coding System using dark green for extreme overbought conditions, dark red for extreme oversold conditions, and gray for neutral zones
- Dual-Line Visualization displaying primary smoothed RSI with prominent line width and secondary smoothed RSI with thinner reference line
- Comparison Mode Coloring implementing synchronized green/red coloring for both lines based on their relative positions
- Background Raw RSI Display showing unsmoothed RSI as subtle background reference when smoothing is applied
- Extreme Zone Highlighting filling area between overbought and oversold levels with subtle background color for clear zone identification
- Reference Line Framework displaying horizontal lines for extreme high, extreme low, and middle levels with customizable transparency
⚙️ Advanced Signal Generation Logic
- Single-Line Mode Signals generating color-coded momentum signals based on smoothed RSI crossing extreme overbought and oversold thresholds
- Comparison Mode Signals creating crossover-based signals when first smoothed RSI crosses above or below second smoothed RSI
- Extreme Level Detection identifying when smoothed RSI enters overbought territory above extreme high threshold or oversold territory below extreme low threshold
- Momentum Shift Recognition highlighting transitions between bullish and bearish momentum states through color changes
- Signal Persistence Tracking maintaining color states until opposing conditions develop for clear trend identification
- Neutral Zone Management displaying gray coloring when RSI remains between extreme thresholds indicating consolidation periods
🔍 Mathematical Implementation Framework
- RSI Calculation Accuracy using Pine Script's built-in RSI function for precise momentum oscillator computation
- DEMA Mathematical Formula implementing double exponential moving average calculation with proper lag reduction methodology
- TEMA Advanced Calculation using triple exponential moving average formulation for enhanced smoothing with minimal lag
- Null Value Protection ensuring continuous calculation through proper handling of undefined values and edge cases
- Smoothing Fallback Logic providing raw RSI values when smoothing calculations encounter mathematical issues
- Precision Maintenance preserving calculation accuracy across different smoothing methods and market conditions
📊 Professional Display Features
- Configurable Extreme Levels supporting custom overbought and oversold threshold settings for different market environments
- Middle Reference Line displaying 50-level dotted line for momentum direction and strength assessment
- Transparency Controls using appropriate transparency levels for background elements and reference lines
- Line Weight Hierarchy implementing visual hierarchy through different line weights for primary and secondary elements
- Zone Fill Visualization providing subtle background fill between extreme levels for immediate zone identification
- Raw RSI Background Reference showing original unsmoothed RSI when smoothing is applied for comparison purposes
⚡ Performance Optimization Features
- Conditional Plotting displaying elements only when relevant smoothing options are enabled for chart performance
- Efficient Calculation Methods using optimized mathematical formulations for real-time smoothing computation
- Memory Management implementing efficient variable usage and calculation sequences for minimal resource consumption
- Real-Time Updates providing immediate smoothed RSI values and color changes with each new price bar
- Error Prevention Framework incorporating validation and fallback mechanisms for reliable indicator operation
- Timeframe Compatibility supporting multiple timeframe analysis with proper gap handling and data continuity
✅ Key Takeaways
- Advanced RSI implementation with sophisticated dual-layer smoothing using nine different moving average methods for enhanced momentum analysis
- VIDYA volatility-adaptive smoothing providing automatic market condition responsiveness for optimal signal quality in different environments
- Dual-smoothing comparison system enabling crossover analysis between two independently configured smoothed RSI lines for enhanced signal generation
- Professional visualization framework with dynamic color coding, extreme zone highlighting, and configurable reference levels for immediate analysis
- Mathematical precision implementation using proper DEMA, TEMA, and VIDYA calculations with comprehensive error handling and edge case management
- Flexible configuration options supporting different trading styles and market conditions through customizable smoothing methods and extreme level thresholds
- Performance-optimized design with conditional plotting and efficient calculations for real-time momentum analysis without chart performance impact
Skrip terproteksi
Skrip ini diterbitkan sebagai sumber tertutup. Namun, anda dapat menggunakannya secara bebas dan tanpa batasan apa pun – pelajari lebih lanjut di sini.
Pernyataan Penyangkalan
Informasi dan publikasi tidak dimaksudkan untuk menjadi, dan bukan merupakan saran keuangan, investasi, perdagangan, atau rekomendasi lainnya yang diberikan atau didukung oleh TradingView. Baca selengkapnya di Persyaratan Penggunaan.