OPEN-SOURCE SCRIPT
Glan Nilly candle Trend
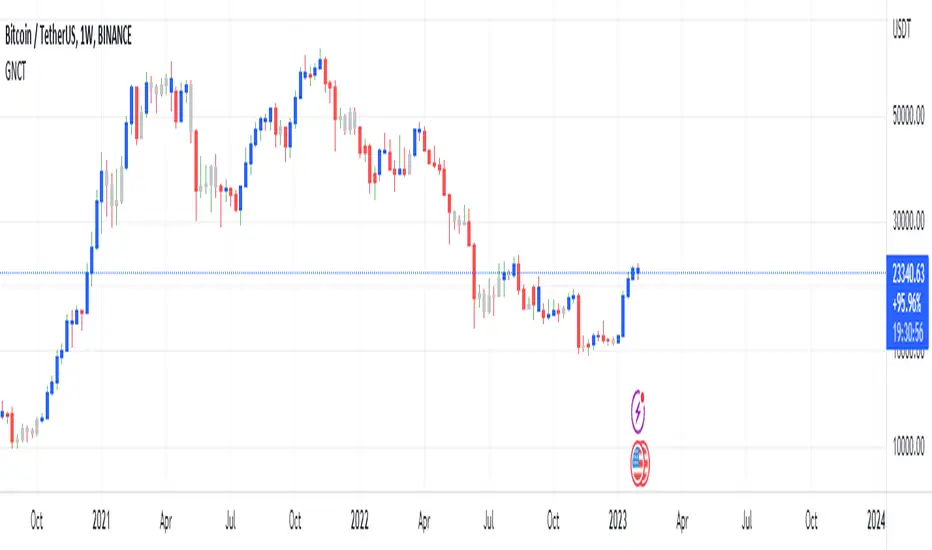
This script is based on Nilly River Theory, and shows up, down, inner and outer bars according that concept.
it can be used for trend recognition. blue after blue candles show continuation of an upward trend.
red after red candles show continuation of a downward trend. gray candles are members of the trend they are within.
An opposite candle color to previous candles shows minor trend reversal. high of the last candle of a blue after blue candles shows a new up(grey candles within the way are part of that trend).
low of the last candle of a red after red candles shows a new down(grey candles within the way are part of that trend).
if the new up is upper and new down is upper than previous ones, then this is real upward trend. if the new up is lower than and new down is lower than previous ones, then this is real downward trend. it is not allowed to trade in opposite direction of a trend and this indicator help us to recognize the trend.
Skrip open-source
Dengan semangat TradingView yang sesungguhnya, pembuat skrip ini telah menjadikannya sebagai sumber terbuka, sehingga para trader dapat meninjau dan memverifikasi fungsinya. Salut untuk penulisnya! Meskipun Anda dapat menggunakannya secara gratis, perlu diingat bahwa penerbitan ulang kode ini tunduk pada Tata Tertib kami.
Pernyataan Penyangkalan
Informasi dan publikasi ini tidak dimaksudkan, dan bukan merupakan, saran atau rekomendasi keuangan, investasi, trading, atau jenis lainnya yang diberikan atau didukung oleh TradingView. Baca selengkapnya di Ketentuan Penggunaan.