Price reversal intraday Indicator
Class: oscillator
Trading type: scalping+intraday trading
Time frame: 15-30 min
Purpose: trading on rebounds and reversals
Level of aggressiveness: aggressive
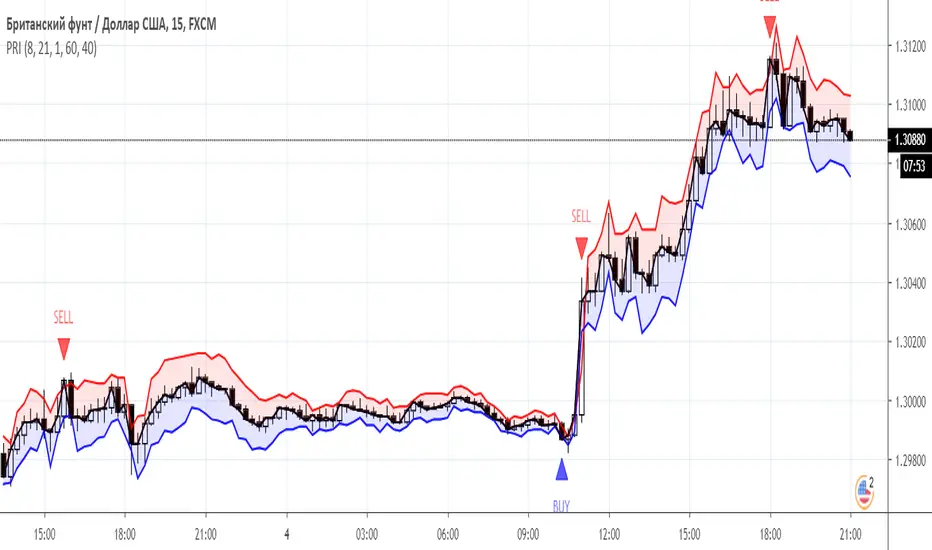
“Price reversal intraday (PRI)” indicator is designed for aggressive intraday trading on rebounds and reversals. It belongs to oscillators. The idea that formed the basis for the creation of “Price reversal intraday (PRI)” is to obtain a synergistic effect from the use of the best oscillatory techniques: modified Bollinger bands and the classic RSI oscillator.
The indicator, using advanced Bollinger technique, monitors the deviation of the current price from the equilibrium value, and then with the help of the RSI oscillator it determines the moment when this deviation reaches a critical point. As a result, a buy or sell signal is generated, which is displayed on the chart in order to facilitate the trading process as much as possible.
Structure of the indicator
Indicator consists of the following elements:
- red zone – indication of a sell zone. Entry into this zone is a signal to close long positions and search for entry points to sell asset;
- red line – extremely high positive deviation of current price from its equilibrium value;
- blue zone - indication of a buy zone. Entry into this zone is a signal to close short positions and search for entry points to buy asset;
- blue line – extremely high negative deviation of current price from its equilibrium value.
Parameters of the indicator
To configure the indicator, the following parameters are provided:
- RSI_period (default value is 8) - period for calculating the RSI oscillator.
- Ranger_period (default value - 21) - period for calculating the modified Bollinger bands.
- Ranger_width (default value - 1) - the parameter used to control the level of aggressiveness of the indicator and frequency of signals. The lower it is, the more signals the indicator will generate. Possible values from 0 to 3.
- ob (the default value is 60) - this parameter defines the overbought zone for the RSI indicator.
- os (the default value is 40) - this parameter defines the oversold zone for the RSI indicator.
Rules of trading
The main task of the trader using indicator is to monitor the location of the current market price relative to the extreme zones (blue/red). Entering the red zone is a signal for closing long positions and searching for sell entry points. Entering the blue zone is a signal for closing short positions and searching for buy entry points.
The appearance of a blue triangle with the inscription “BUY” on the chart is a signal to open buy positions, and a red triangle with the inscription “SELL” is a signal for sale.
Skrip hanya-undangan
Hanya pengguna yang disetujui oleh penulis yang dapat mengakses skrip ini. Anda perlu meminta dan mendapatkan izin untuk menggunakannya. Izin ini biasanya diberikan setelah pembayaran. Untuk detail selengkapnya, ikuti petunjuk penulis di bawah ini atau hubungi Trade24Fx secara langsung.
TradingView TIDAK menyarankan untuk membayar atau menggunakan skrip kecuali Anda sepenuhnya mempercayai pembuatnya dan memahami cara kerjanya. Anda juga dapat menemukan alternatif yang gratis dan sumber terbuka di skrip komunitas kami.
Instruksi penulis
bit.ly/2oBvkHY
Больше информации на нашем ютьюб-канале
youtube.com/channel/UCYEOurJfasXWyYnrriGwsqQ
Pernyataan Penyangkalan
Skrip hanya-undangan
Hanya pengguna yang disetujui oleh penulis yang dapat mengakses skrip ini. Anda perlu meminta dan mendapatkan izin untuk menggunakannya. Izin ini biasanya diberikan setelah pembayaran. Untuk detail selengkapnya, ikuti petunjuk penulis di bawah ini atau hubungi Trade24Fx secara langsung.
TradingView TIDAK menyarankan untuk membayar atau menggunakan skrip kecuali Anda sepenuhnya mempercayai pembuatnya dan memahami cara kerjanya. Anda juga dapat menemukan alternatif yang gratis dan sumber terbuka di skrip komunitas kami.
Instruksi penulis
bit.ly/2oBvkHY
Больше информации на нашем ютьюб-канале
youtube.com/channel/UCYEOurJfasXWyYnrriGwsqQ