OPEN-SOURCE SCRIPT
MA Direction Histogram
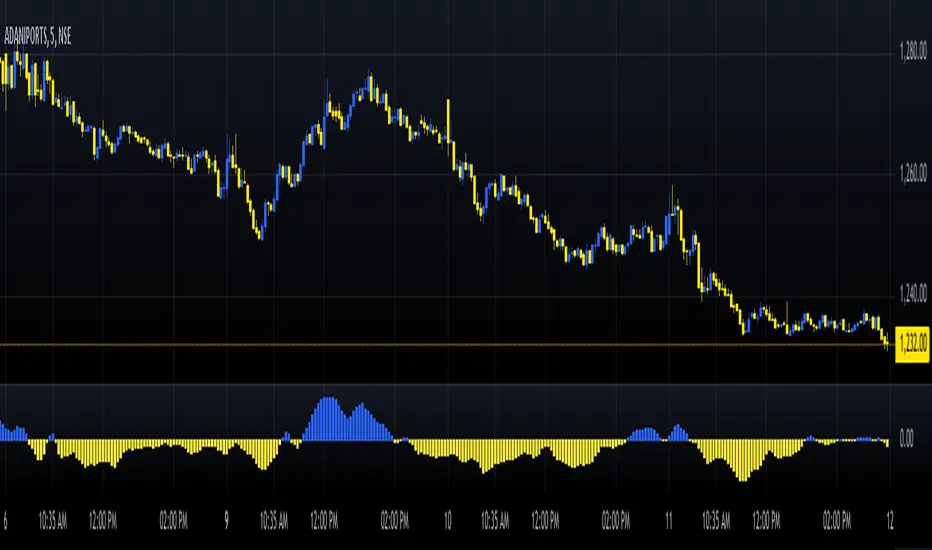
The MA Direction Histogram is a simple yet powerful tool for visualizing the momentum of a moving average (MA). It highlights whether the MA is trending up or down, making it ideal for identifying market direction quickly.
Key Features:
1. Custom MA Options: Choose from SMA, EMA, WMA, VWMA, or HMA for flexible analysis.
2. Momentum Visualization: Bars show the difference between the MA and its value from a lookback period.
- Blue Bars: Upward momentum.
- Yellow Bars: Downward momentum.
3. Easy Customization: Adjust the MA length, lookback period, and data source.
How to Use:
- Confirm Trends: Positive bars indicate uptrends; negative bars suggest downtrends.
- *Spot Reversals: Look for bar color changes as potential reversal signals.
Compact, intuitive, and versatile, the "MA Direction Histogram" helps traders stay aligned with market momentum. Perfect for trend-based strategies!
Skrip open-source
Dengan semangat TradingView yang sesungguhnya, pembuat skrip ini telah menjadikannya sebagai sumber terbuka, sehingga para trader dapat meninjau dan memverifikasi fungsinya. Salut untuk penulisnya! Meskipun Anda dapat menggunakannya secara gratis, perlu diingat bahwa penerbitan ulang kode ini tunduk pada Tata Tertib kami.
Pernyataan Penyangkalan
Informasi dan publikasi ini tidak dimaksudkan, dan bukan merupakan, saran atau rekomendasi keuangan, investasi, trading, atau jenis lainnya yang diberikan atau didukung oleh TradingView. Baca selengkapnya di Ketentuan Penggunaan.