OPEN-SOURCE SCRIPT
Diupdate Moving Average Gap Analyzer
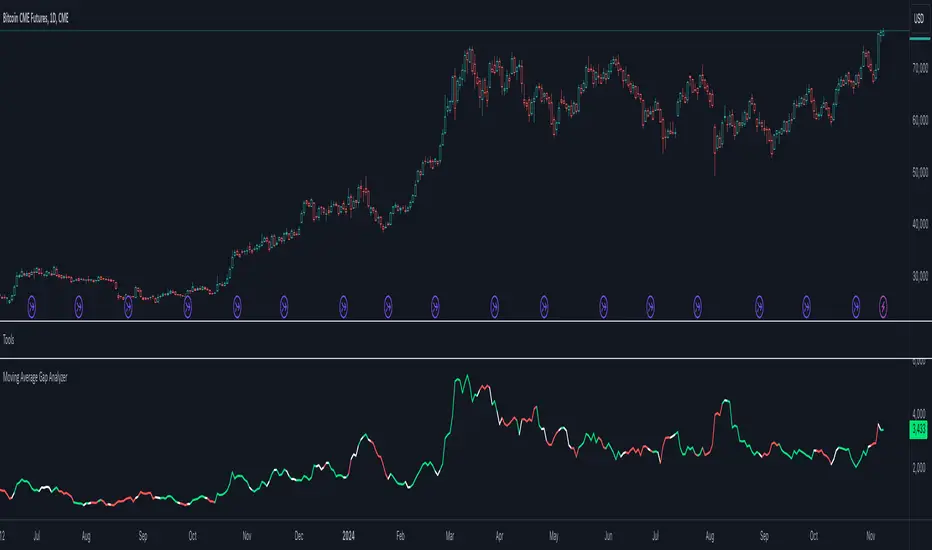
Extremely simple algorithm in order to calculate the gap between 2 simple moving averages. Analyzing perspective defines the line of color as white, green or red. This is done by checking sources of both moving averages and evaluate their past values with the mutual length respectively. Analysis is done by scoring the movements of sources.
What to expect?
- Higher the gap, higher the volatility.
- If the analysis line is green sources have been raising (most likely bull market), if the analysis line is white the market is mostly likely close to horizontal, if the analysis line is red, sources have been decreasing gradually (most likely bear market).
ps. Genuine indicator idea of me. This indicator is not a product or an idea of any group I work with. Completely clear of all types of IP.
Catatan Rilis
- Option for selecting MA type added.Catatan Rilis
- Script updated from Pine Script v4 to Pine Script v5
- Dynamic moving average function moved to a library (Tools)
- Strict variable types implemented & applied
Skrip open-source
Dengan semangat TradingView yang sesungguhnya, pembuat skrip ini telah menjadikannya sebagai sumber terbuka, sehingga para trader dapat meninjau dan memverifikasi fungsinya. Salut untuk penulisnya! Meskipun Anda dapat menggunakannya secara gratis, perlu diingat bahwa penerbitan ulang kode ini tunduk pada Tata Tertib kami.
Pernyataan Penyangkalan
Informasi dan publikasi ini tidak dimaksudkan, dan bukan merupakan, saran atau rekomendasi keuangan, investasi, trading, atau jenis lainnya yang diberikan atau didukung oleh TradingView. Baca selengkapnya di Ketentuan Penggunaan.