OPEN-SOURCE SCRIPT
HTF Range
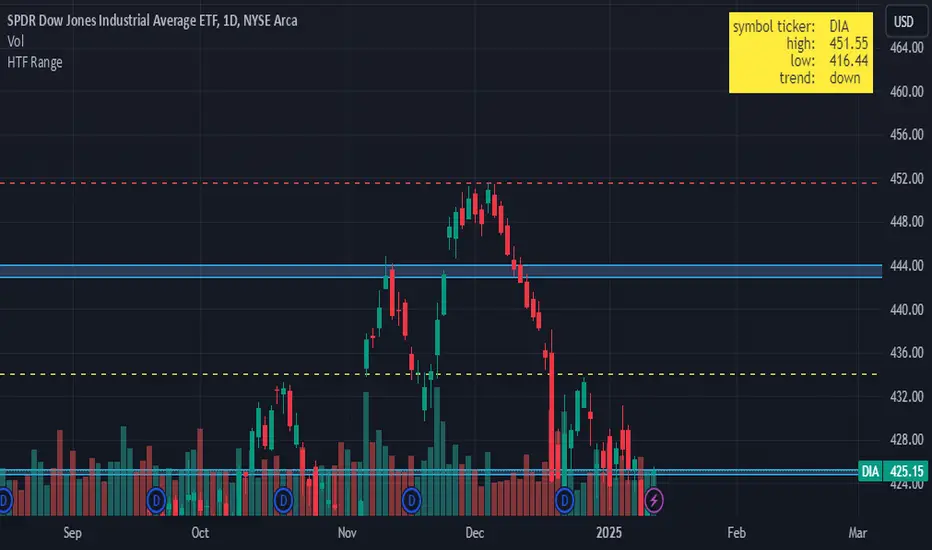
This Pine Script indicator, HTF Range, is a tool designed to help traders visualize predefined ranges (highs and lows) and analyze price action within those levels. It's particularly useful for identifying key levels and trends for a set of pre-configured assets, such as cryptocurrencies, stocks, and forex pairs.
Key Features:
1. Predefined Symbol Ranges:
2. Range Visualizations:
3. Configurable Inputs:
4. Dynamic Calculations:
5. Table Display:
Use Case:
This indicator is ideal for traders who:
Key Features:
1. Predefined Symbol Ranges:
- Stores a list of assets (tickers) with corresponding high, low, and trend information in an array.
- Automatically matches the current symbol on the chart (syminfo.ticker) to fetch and display relevant range data:
- High Range: The upper price level.
- Low Range: The lower price level.
- Trend: Indicates whether the trend is "up" or "down."
- Example tickers: BTCUSDT, ETHUSDT, GBPUSD, NVDA, and more.
2. Range Visualizations:
- Extremeties: Draws dashed horizontal lines for the high and low levels.
- Half-Level: Marks the midpoint of the range with a dashed yellow line.
- Upper and Lower Quarters: Highlights upper and lower portions of the range using shaded boxes with customizable extensions:
3. Configurable Inputs:
- Enable/Disable Levels: Toggles for extremeties, half-levels, and quarter-levels.
- Table Info: Option to display a table summarizing the range data (symbol, high, low, and trend).
4. Dynamic Calculations:
- Automatically calculates the difference between the high and low (diff) for precise range subdivisions.
- Dynamically adjusts visuals based on the trend (up or down) for better relevance to the market condition.
5. Table Display:
- Provides a detailed summary of the asset's range and trend in the top-right corner of the chart:
- Symbol ticker.
- High and low levels.
- Overall trend direction.
Use Case:
This indicator is ideal for traders who:
- Trade multiple assets and want a quick overview of key price ranges.
- Analyze price movements relative to predefined support and resistance zones.
- Use range-based strategies for trend following, breakout trading, or reversals.
Skrip open-source
Dengan semangat TradingView yang sesungguhnya, pembuat skrip ini telah menjadikannya sebagai sumber terbuka, sehingga para trader dapat meninjau dan memverifikasi fungsinya. Salut untuk penulisnya! Meskipun Anda dapat menggunakannya secara gratis, perlu diingat bahwa penerbitan ulang kode ini tunduk pada Tata Tertib kami.
Pernyataan Penyangkalan
Informasi dan publikasi ini tidak dimaksudkan, dan bukan merupakan, saran atau rekomendasi keuangan, investasi, trading, atau jenis lainnya yang diberikan atau didukung oleh TradingView. Baca selengkapnya di Ketentuan Penggunaan.